

How to Assess a Stock Before Buying It (3-Step Framework)
Knowing how to assess a stock before buying it means separating a good business from a good investment decision. A company can have strong products, growing revenue, and a recognizable brand while still being too expensive, too risky, or simply wrong for your portfolio.
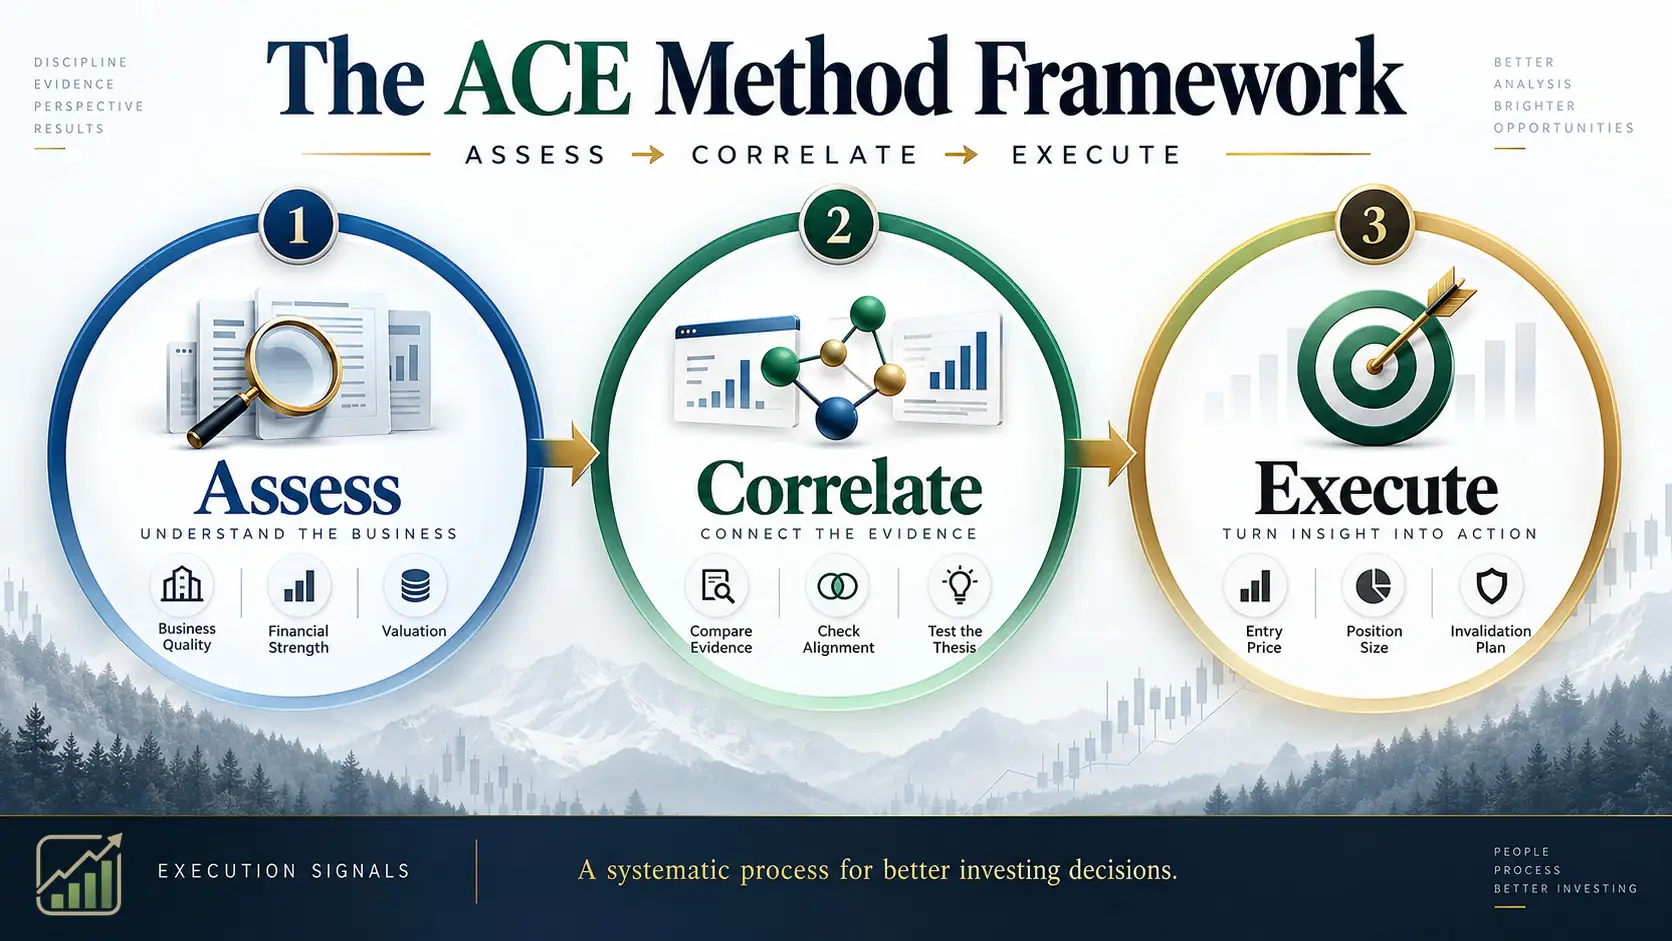
I use a three part process: assess the business, correlate the evidence, and execute only when the potential reward justifies the risk. This approach does not predict the market. It helps you make a decision based on financial evidence rather than headlines, price excitement, or someone else’s stock tip.
Table Of Contents
Assess The Business Before Looking At The Price
Correlate Financial Evidence, Valuation, And Risk
Assess The Business Before Looking At The Price
The first question is not, “Will this stock go up?” It is, “Is this business strong enough to deserve further research?”
A stock represents ownership in a business. Before considering charts, analyst ratings, or price targets, I would first understand what the company sells, who pays for it, what could disrupt it, and whether it produces durable cash flow.
Start With The Company’s Business Model
Read the company’s annual report and ask simple questions in plain English:
• What products or services generate revenue?
• Who are the largest customers?
• Is demand recurring, seasonal, cyclical, or dependent on one major contract?
• What makes customers choose this company over competitors?
• What could make customers leave?
A software company with subscription revenue may have a different risk profile than a retailer that depends on holiday sales. A utility may have steady demand but heavy debt and regulatory exposure. A bank’s balance sheet requires a different lens than a technology company’s balance sheet.
This is why one ratio rarely tells the whole story. A low P/E ratio may look attractive, but it can also reflect shrinking earnings, a weak industry, or a balance sheet problem. A high P/E ratio may be justified by rapid growth, but only if growth is likely to continue and the valuation already does not assume perfection.
The SEC advises investors to review financial statements and understand investment disclosures before purchasing stock. Its guidance on reviewing company disclosures before investing is a useful reminder that a ticker symbol is not enough information for a purchase decision.
Use A Filing First Research Workflow
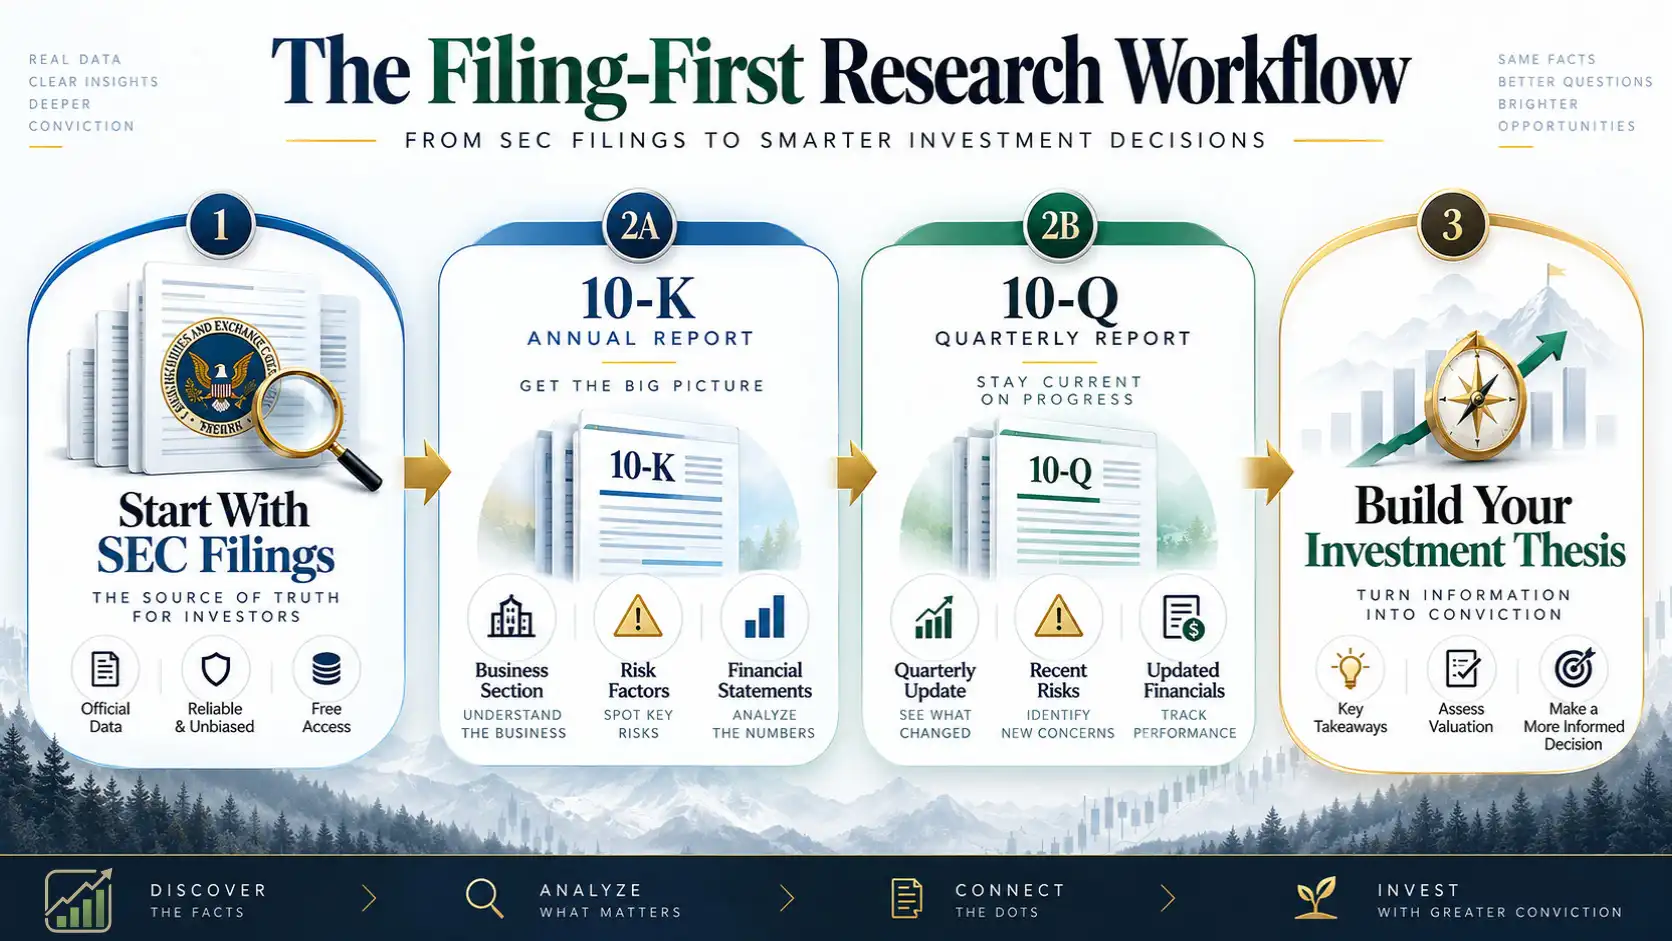
Financial websites are useful for screening, but company filings should answer the questions that summaries often skip. Public companies file reports through EDGAR, the SEC’s database.
Start with the Form 10 K, then use the most recent Form 10 Q to see whether the annual story still holds up. The 10 K gives the broad picture. The 10 Q helps confirm whether recent results support, weaken, or complicate that picture.
Filing Section | What To Look For | Why It Matters |
|---|---|---|
Business | Revenue sources, customers, products, geography | Shows how the company actually earns money |
Management Discussion And Analysis | Revenue drivers, margins, liquidity, management explanations | Helps explain changes behind the numbers |
Risk Factors | Competition, regulation, customer concentration, supply issues | Tests the downside case before buying |
Financial Statements | Revenue, profit, debt, cash flow, share count | Provides the core financial evidence |
Notes To Financial Statements | Revenue recognition, stock compensation, acquisitions | Reveals details that headline metrics can hide |
Legal Proceedings | Litigation, investigations, regulatory matters | Identifies risks that may affect future results |
Do not read a filing as though every page carries equal weight. Start with the business description, Management Discussion and Analysis, risk factors, cash flow statement, debt notes, and share based compensation notes. Then go deeper where something does not make sense.
For example, if revenue is growing quickly but accounts receivable are rising faster, the company may be collecting cash more slowly. That does not automatically mean the business is failing. It does mean the investor should investigate whether customers are delaying payments, whether sales terms changed, or whether reported revenue is getting ahead of cash collection.
SEC required disclosures exist to help investors evaluate whether to buy, sell, or hold a security, as explained in Investor.gov’s overview of researching investments. Use those disclosures to build your own view before reading opinions about the company.
Separate Earnings From Cash Generation
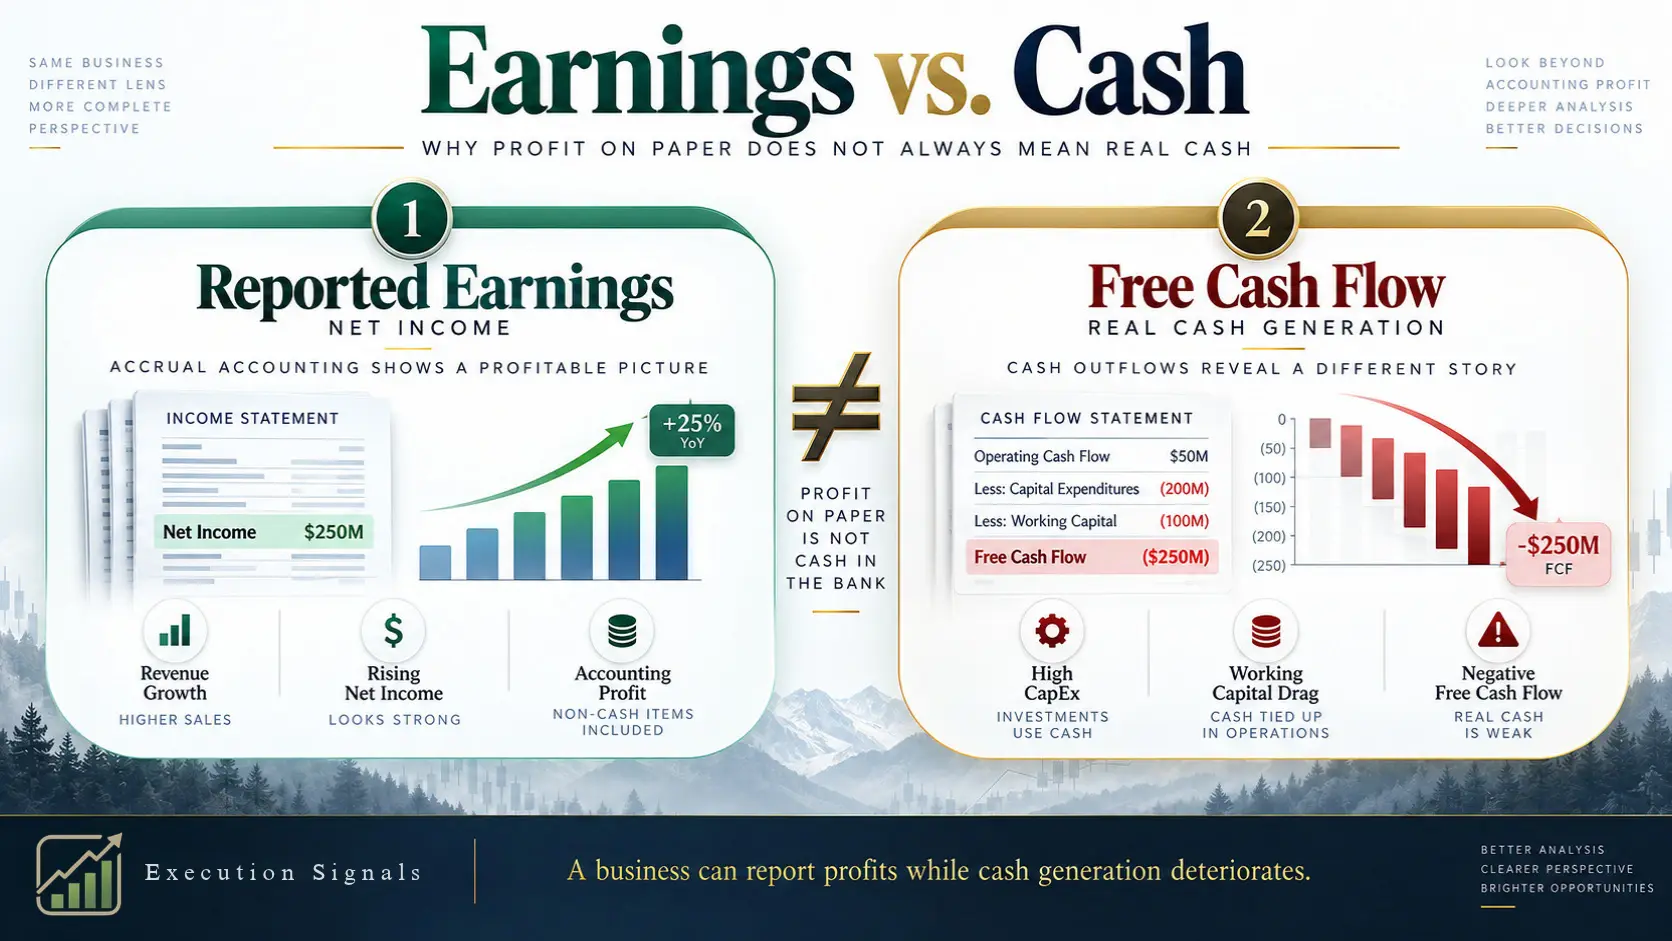
A profitable company can still have weak cash generation. Net income is based on accounting rules. Operating cash flow shows how much cash the business generates from its normal operations. Free cash flow generally takes operating cash flow and subtracts capital expenditures.
That difference matters because a company cannot indefinitely pay debt, fund dividends, repurchase stock, or invest in growth using accounting earnings alone.
Look for the relationship among these three measures:
Net income: Is reported profit growing, flat, or falling?
Operating cash flow: Does ordinary business activity produce cash?
Free cash flow: After necessary capital spending, is cash available for debt reduction, reinvestment, dividends, or buybacks?
Consider two companies with the same earnings per share. Company A converts most of its earnings into operating cash flow. Company B reports growing earnings but continually needs more inventory, more equipment, or more working capital just to maintain growth. Company B may still be investable, but its financial demands are greater and its margin for error may be smaller.
Also examine the weighted average share count. Revenue growth and total earnings growth can look impressive while per share results lag because the company issues shares for employee compensation, acquisitions, or financing. Dilution reduces each existing shareholder’s percentage ownership. A company does not need to avoid stock compensation entirely, but investors should ask whether per share growth is keeping pace with the total business growth.
Correlate Financial Evidence, Valuation, And Risk
After deciding that a company deserves attention, the next task is to determine whether the evidence agrees. Strong revenue growth alone is not confirmation. Strong margins alone are not confirmation. A rising stock price alone is not confirmation.
The goal is to see whether business quality, financial condition, valuation, industry conditions, and market behavior support the same conclusion.
Compare The Right Metrics With The Right Peers
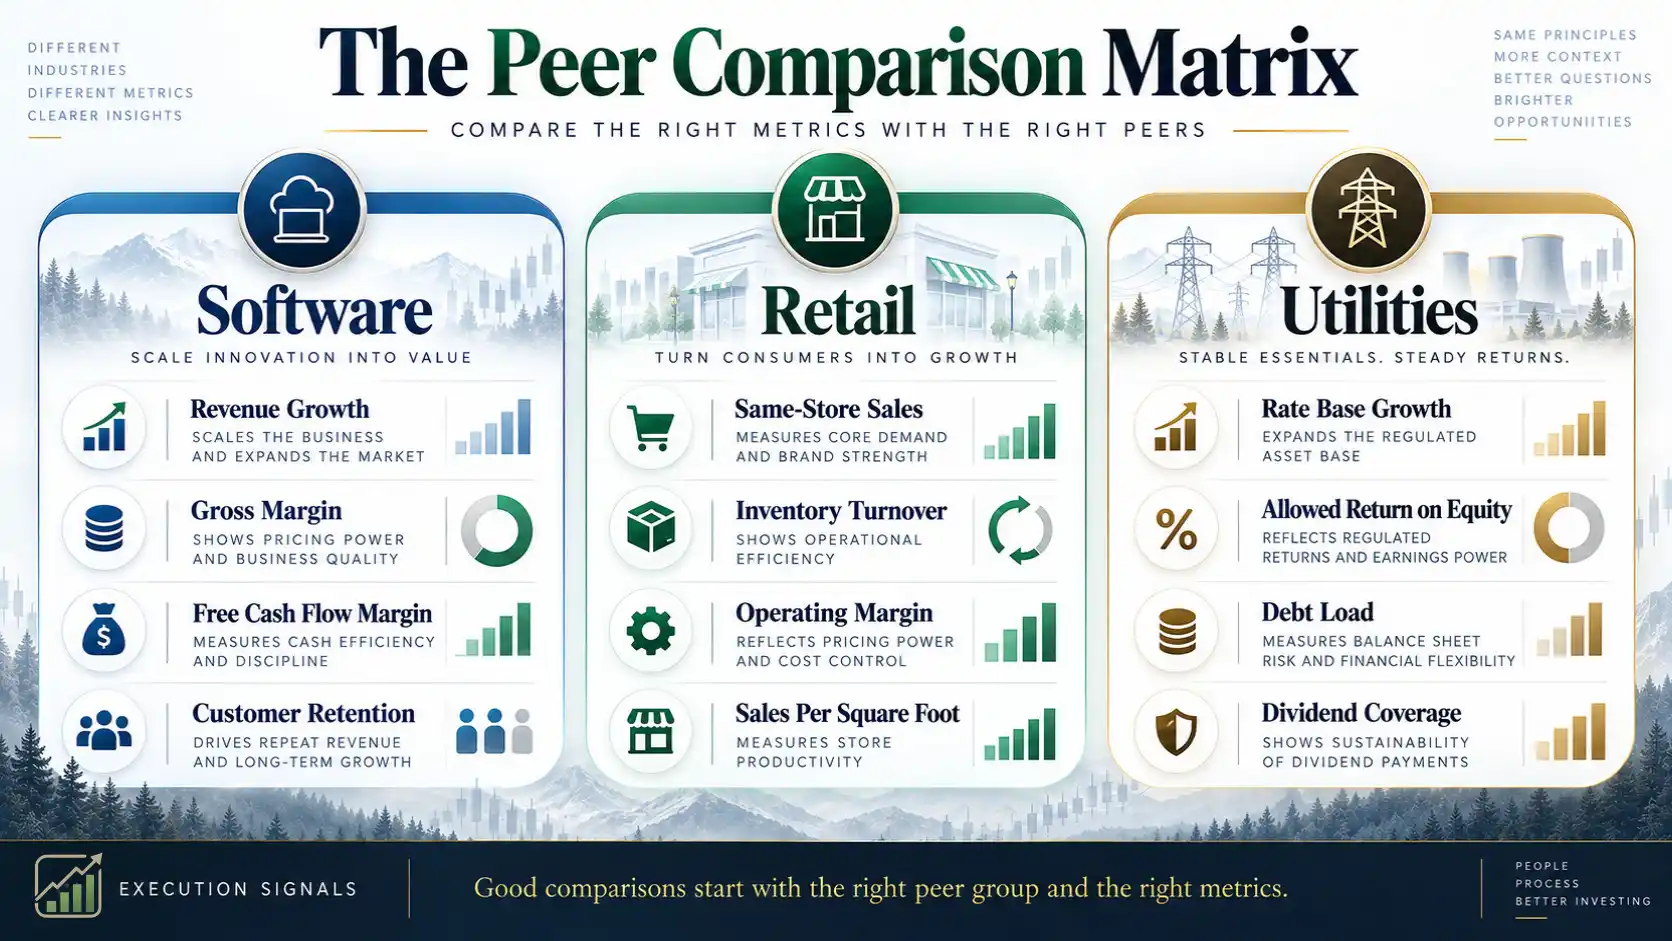
A valuation ratio is meaningful only when placed in context. Comparing a utility’s P/E ratio with a cloud software company’s P/E ratio may create more confusion than insight. Their growth rates, debt needs, margins, and capital requirements are different.
Use a peer group with similar economics. Compare companies that serve similar customers, operate in similar regions, face similar regulation, and use similar business models.
Business Type | Metrics That Often Deserve Extra Attention | Common Limitation |
|---|---|---|
Software | Revenue growth, recurring revenue, operating margin, free cash flow | High valuation may depend on continued rapid growth |
Retail | Same store sales, inventory, gross margin, operating cash flow | Consumer demand can change quickly |
Utilities | Debt, interest expense, regulatory environment, dividend coverage | Capital spending needs can be substantial |
Banks | Loan quality, capital levels, net interest income | Traditional debt ratios may not be directly comparable |
Manufacturers | Backlog, margins, inventory, capital expenditures | Results can be sensitive to economic cycles |
P/E compares share price with earnings per share. Price to book compares market value with book value. ROE measures earnings relative to shareholder equity. Debt to equity compares borrowing with shareholder capital. These are useful tools, but no universal cutoff makes a stock automatically cheap, safe, or attractive.
For instance, a company with a higher P/E ratio than its peers may deserve that premium if it has stronger margins, faster growth, lower debt, and a durable competitive advantage. On the other hand, a company with a lower P/E may be discounted because its earnings are expected to decline. The work is finding out why the difference exists.
Test The Competitive Advantage And Downside Case
A competitive advantage, often called an economic moat, should be supported by evidence rather than a familiar brand name. Possible signs include switching costs, network effects, cost advantages, regulatory licenses, valuable intellectual property, or distribution strength.
The more important question is whether that advantage can protect future profitability.
Ask what would invalidate the bullish thesis:
• Could one large customer leave?
• Could lower priced competitors pressure margins?
• Could regulation change the business model?
• Could refinancing debt become more expensive?
• Could a new technology make the company’s product less relevant?
• Could management’s forecast depend on unusually favorable conditions?
This exercise changes the decision from “What could go right?” to “What would prove me wrong?” That is a more useful question before capital is committed.
Risk factors in the 10 K can be long and legalistic. Still, they deserve attention. Compare management’s growth story with the company’s own risk disclosures. If an investor believes revenue will rise because of one product, but the filing says that product faces patent challenges, intense competition, or customer concentration, the thesis needs more caution.
Use Technical Analysis For Timing, Not Proof
Fundamental analysis estimates business quality and potential value. Technical analysis studies price, volume, trend, support, resistance, and momentum. They can work together, but they answer different questions.
A chart cannot prove that a company is financially healthy. Likewise, strong financial statements do not guarantee that buying at any price is wise.
Technical analysis may help with entry timing after the fundamental case is already reasonable. For example, an investor may identify a financially strong company trading at an acceptable valuation but wait for price stabilization rather than buying during a sharp decline. That is a timing decision, not proof that the business is worth owning.
The same principle applies to analyst ratings. Analyst research can identify useful questions, but it should not replace your work. The SEC states that investors should not rely solely on analyst recommendations and should review company filings and offering documents independently. Read the SEC’s guidance on analyzing analyst recommendations, especially when a firm may have business relationships connected to an offering.
Execute With A Written Purchase Plan
The final decision is not simply buy or do not buy. It is deciding whether the stock fits your portfolio, what price would be acceptable, how much risk you are taking, and what evidence would cause a review.
This is where a sound analysis becomes a disciplined investment decision.
Separate Business Quality From Portfolio Suitability
A high quality company may not fit your portfolio. It may be too volatile for your risk tolerance, too concentrated in a sector you already own, or too expensive relative to your expected return.
Before buying, separate these decisions:
Decision | Core Question | Possible Answer |
|---|---|---|
Business Quality | Is the company financially durable and competitively sound? | Strong, mixed, weak |
Valuation | Does the current price leave room for reasonable returns? | Attractive, fair, expensive |
Portfolio Suitability | Does this position fit my goals and risk limits? | Buy, watch, pass |
This distinction prevents a common mistake: treating a good company as an automatic buy. A company can be excellent and still be a poor purchase at an inflated price. A cheap company can also be unsuitable if its debt, volatility, or business risk conflicts with your financial needs.
I would also consider correlation inside the portfolio. Owning several companies tied to the same economic driver can create concentrated exposure even when the companies have different names. For example, several semiconductor stocks, banks, or energy producers may all respond sharply to the same industry conditions.
Define Price, Position Size, And Invalidation
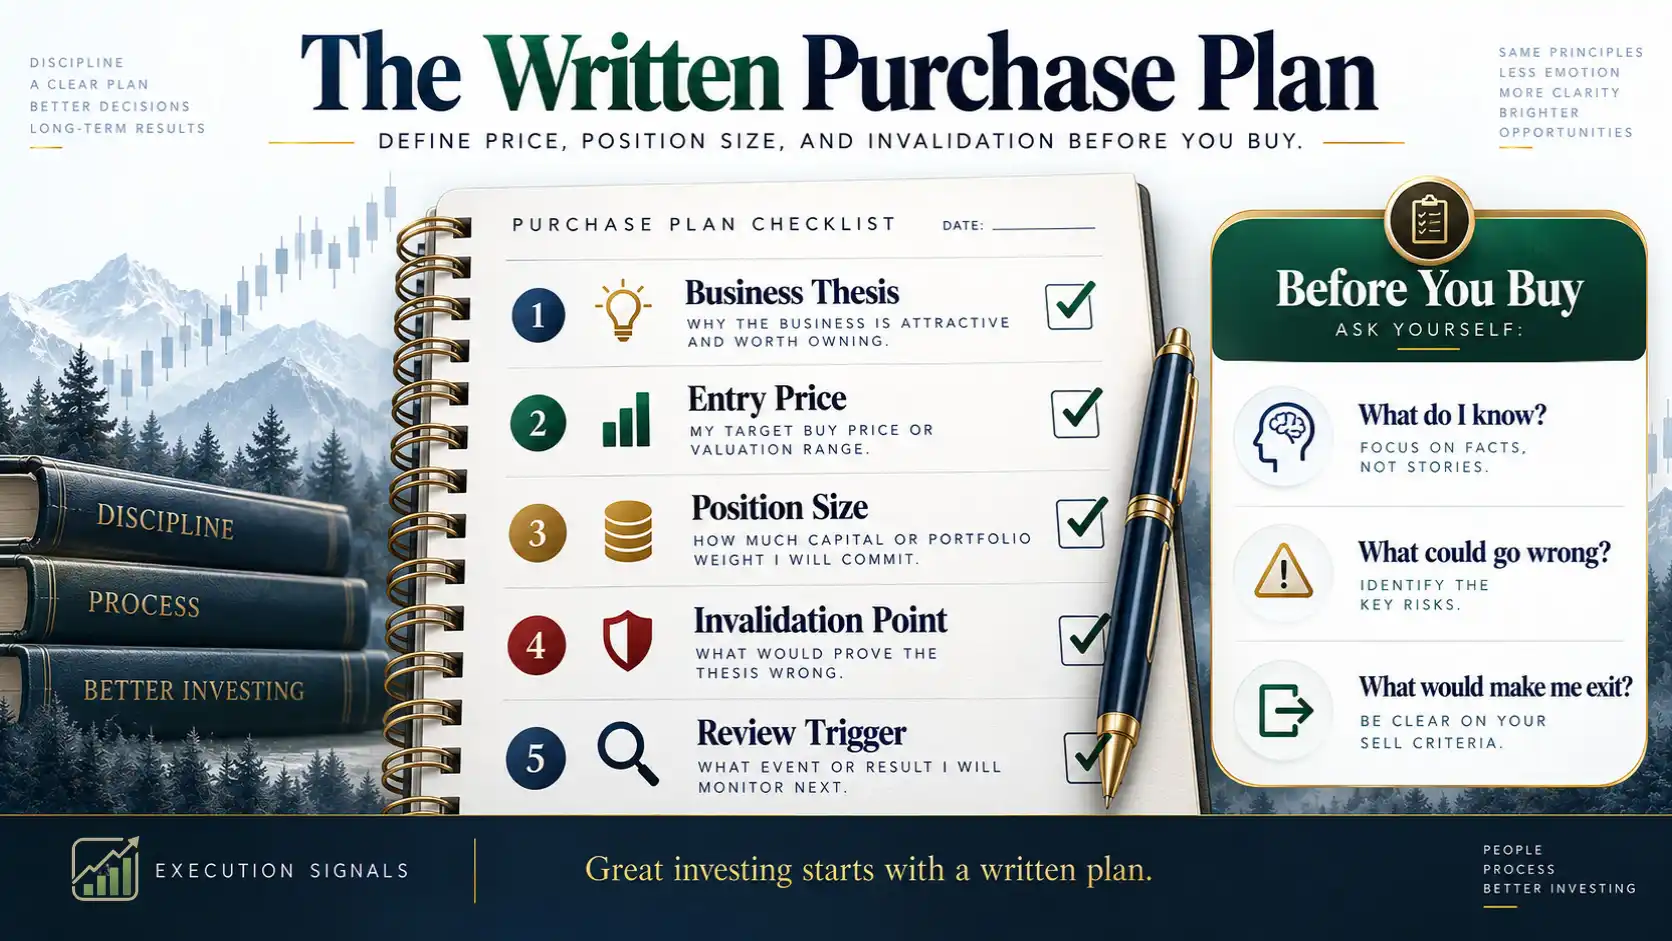
Write the plan before placing the order. A basic pre purchase record should include:
Thesis: Why does this company deserve ownership?
Buy range: What price or valuation makes the purchase reasonable?
Position size: How much of the portfolio can this represent?
Risk point: What business development, price level, or financial change would require a review?
Review date: When will you revisit the thesis and quarterly results?
A margin of safety is the gap between your estimate of value and the price you are willing to pay. There is no universal percentage that fits every stock. A stable company with predictable cash flow may require a different margin than a smaller company with uncertain growth.
Fair warning: a lower purchase price does not automatically create safety. If the business is weakening, the estimated value may also be falling. The goal is not to buy a stock that has dropped the most. It is to buy only when the evidence supports the price and the risk is understandable.
Use a stock profit loss calculator to model possible outcomes before placing an order. Test more than the optimistic case. Calculate what happens if the stock falls, if you buy at a higher price than planned, or if the position becomes larger than intended.
Turn Research Into A Repeatable Decision
The most practical framework is to assess, correlate, execute investment decisions in sequence.
Assess asks whether the business is worth investigating. Correlate asks whether the financial, valuation, technical, sector, and risk evidence agree. Execute asks whether there is a disciplined way to take the position while controlling downside.
The process should allow three outcomes:
• Pass: The evidence is weak, the valuation is excessive, or the stock does not fit the portfolio.
• Wait: The business may be attractive, but the price, market conditions, or missing information do not justify action yet.
• Execute: The thesis, valuation, risk limits, and portfolio fit are clear enough to proceed.
Choosing to wait is not indecision. It is a valid result when the available evidence does not justify taking risk. For a closer look at this framework, review the ACE method for investing.
Key Takeaways
Build Decisions From Evidence, Not Excitement
• Review the business model before reviewing the stock chart.
• Read the Form 10 K and the latest Form 10 Q, with attention to risks, cash flow, debt, dilution, and management discussion.
• Treat earnings and cash generation as separate tests. Rising EPS does not always mean the business is generating strong cash flow.
• Compare valuation ratios with relevant peers, not with arbitrary market wide standards.
• Test the downside case before estimating the upside case.
• Decide whether the stock is a good business, a reasonably priced stock, and a suitable portfolio position. These are separate decisions.
• Write a buy range, position size, invalidation condition, and review date before purchasing.
A disciplined process does not eliminate losses. It helps prevent avoidable mistakes caused by incomplete research, oversized positions, and emotional decisions.
Frequently Asked Questions
What Should I Check First Before Buying A Stock?
Start with the business model. Understand what the company sells, how it earns revenue, who its customers are, and what could disrupt demand. Then review the latest annual and quarterly filings before relying on valuation ratios or analyst ratings.
Which SEC Filings Should I Read Before Buying A Stock?
Read the most recent Form 10 K for the annual picture and the latest Form 10 Q for recent developments. Pay close attention to Management Discussion and Analysis, risk factors, the cash flow statement, debt notes, share based compensation, and legal proceedings.
How Do I Tell Whether A Company Is Financially Healthy?
Look at revenue trends, profitability, operating cash flow, free cash flow, debt obligations, interest costs, and liquidity. Health is not one ratio. It is the company’s ability to operate, meet obligations, and fund its needs without excessive financial strain.
Why Can A Profitable Company Have Weak Cash Flow?
Accounting earnings may include revenue that has not been collected in cash, while the company may also need to spend heavily on inventory, equipment, or working capital. Compare net income with operating cash flow over several reporting periods to see whether profits are turning into cash.
How Do Stock Dilution And Stock Compensation Affect Investors?
When a company issues more shares, each existing share can represent a smaller ownership stake. Review share count trends along with revenue and EPS growth. Business growth is more valuable to shareholders when per share results also improve.
Should I Trust Analyst Ratings And Price Targets?
Use analyst research as one input, not a final answer. Ratings and price targets are based on assumptions that may change. Check the company’s filings, compare multiple viewpoints, and decide whether the stock fits your own goals and risk limits.
How Do I Know Whether A Stock Is Overvalued Or Undervalued?
Compare valuation measures such as P/E, price to sales, price to book, and free cash flow yield with relevant peers and the company’s own history. Then ask whether the current price already assumes unusually strong growth, margin expansion, or ideal market conditions.
Sources
Verified References
U.S. Securities and Exchange Commission — Taking Stock: https://www.sec.gov/about/reports-publications/investorpubstakingstockhtm
Investor.gov — Research Before You Invest: https://www.investor.gov/research-you-invest
U.S. Securities and Exchange Commission — Analyzing Analyst Recommendations: https://www.sec.gov/investor/pubs/analysts.htm
Fidelity Investments — What is stock analysis and how do you do it?: https://www.fidelity.com/learning-center/trading-investing/stock-analysis
SoFi — How to Evaluate a Stock Before You Buy: https://www.sofi.com/learn/content/how-to-evaluate-stocks/
Disclaimer:
This article is for educational purposes only and does not constitute financial, investment, or legal advice. Always consider your own financial situation and, if needed, consult a licensed financial professional.