
The 3-Step 'ACE' Framework Professional Traders Use to Filter Noise and Protect Capital
What is the ACE Method for investing? ACE is a decision-making system, not a stock-picking formula. It stands for Assess, Correlate, Execute.
I use the framework to separate three questions that investors often blend together too quickly:
Is this opportunity worth researching?
Does the evidence support the idea?
And what is the safest, most deliberate way to act?
That sequence matters. A company can be excellent but overpriced. A stock can look cheap but have a weakening business. A sound investment thesis can still produce a poor result if the position is too large, the entry is rushed, or the investor sells in panic during a normal decline.
What Is the ACE Method for Investing?
What The ACE Method Is And Is Not
ACE Is Not A Universal Industry Standard
How Assess, Correlate, And Execute Work
Assess: Decide Whether The Opportunity Deserves Attention
Correlate: Test Whether The Evidence Agrees
Execute: Turn Research Into A Risk-Controlled Decision
How To Apply ACE To An Investment Decision
Start With Your Portfolio Before The Ticker Symbol
Use A Simple ACE Research Record
Review Decisions After The Outcome Is Known
Benefits, Limits, And Comparisons
Comparing ACE With Other Approaches
What Does ACE Stand For In The ACE Method For Investing?
Is The ACE Method A Standardized Investment Strategy?
Is ACE Active Investing Or Passive Investing?
Does The ACE Method Use Fundamental Or Technical Analysis?
Does A Confirmed ACE Setup Mean I Should Buy?
Can The ACE Method Guarantee Better Returns?
What The ACE Method Is And Ain't
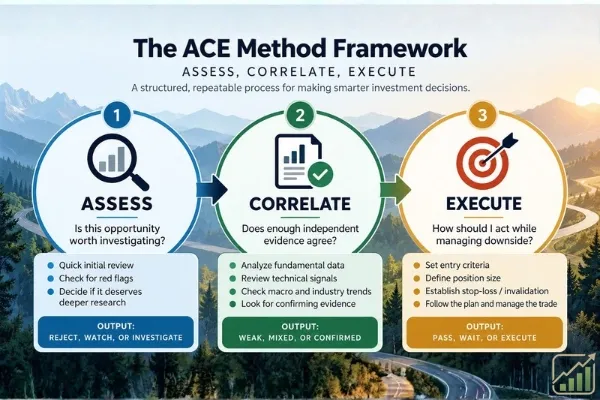
The ACE Method™ is designed to make investment decisions more repeatable. Rather than asking, “What stock should I buy?” it asks a more useful question:
What process should I follow before putting capital at risk?
The method has three stages:
ACE Stage | Primary Decision Problem | Typical Output |
|---|---|---|
Assess | Is this opportunity worth investigating? | Reject, Watch, or Investigate |
Correlate | Does enough independent evidence agree? | Weak, Mixed, or Confirmed |
Execute | How should I act while managing downside? | Pass, Wait, or Execute |
The purpose is not to predict markets with certainty. Markets don't offer certainty. The purpose is to reduce preventable mistakes such as buying from excitement, concentrating too heavily in one idea, or changing a plan after a price move creates fear.
ACE Is Not A Universal Industry Standard
Fair warning: “ACE” does not have one accepted meaning across the investing industry. Different publishers, products, and financial-planning materials use the same acronym for unrelated ideas.
For example, Vanguard Canada uses ACE to mean attentiveness, commitment, and empathy in its behavioral framework. That approach focuses on investor behavior and decision design, not on selecting stocks or setting trade entries.
Other ACE references describe stock baskets, actively managed portfolios, financial-planning steps, or trading systems. Before evaluating any ACE-branded offering, identify four things:
What the letters mean. Ask for the full acronym, not just the label.
What the investor is buying. Is it education, software, a managed portfolio, a stock basket, or a trading service?
Which assets it uses. The approach may involve stocks, ETFs, options, short positions, crypto products, or a mix.
How decisions are implemented. Look for clear rules on selection, position sizing, fees, risk limits, and exits.
A label alone doesn't establish expected returns, regulatory status, tax treatment, or suitability for a U.S. investor.
Key Takeaways
• The ACE Method™ means Assess, Correlate, Execute in the Execution Signals framework.
• It is a process for evaluating and managing investment decisions, not a promise that any stock will rise.
• Assess filters noise, Correlate tests whether evidence agrees, and Execute defines risk before capital is committed.
• A disciplined process can improve consistency, but it can't remove market risk or guarantee gains.
• Investors should distinguish this ACE Method from unrelated ACE portfolios, stock baskets, behavioral frameworks, and trading systems.
How Assess, Correlate, And Execute Work
Assess: Decide Whether The Opportunity Deserves Attention
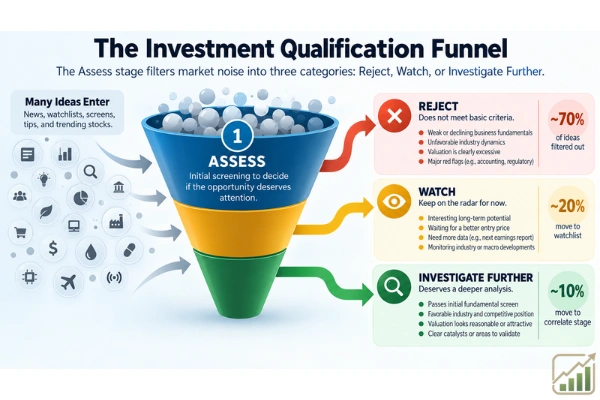
Assess is the qualification stage. I'm not deciding to buy at this point. I'm deciding whether an opportunity deserves more time, research, and capital consideration.
A practical assessment can include:
• Business quality and competitive position
• Revenue, earnings, cash flow, debt, and profitability trends
• Valuation relative to the company’s growth prospects and risks
• Potential catalysts, such as a new product, improving margins, or industry recovery
• Risks that could weaken the original thesis
• Fit with the investor’s goals, time horizon, and asset allocation
Consider a profitable company whose revenue is growing steadily. That is not enough by itself. If the stock price already assumes years of perfect execution, the investment may not offer an attractive margin of safety.
A strong company and a strong investment are related, but they are not identical.
The output should be clear: Reject, Watch, or Investigate Further. This step prevents a trending ticker symbol, an online recommendation, or a sudden price jump from becoming an immediate purchase.
Correlate: Test Whether The Evidence Agrees
Correlate means to run it through "The Jury Trial." You're the prosecutor; the stock is the defendant. If the evidence (Fundamentals, Technicals, Macro) doesn't agree, the stock is Guilty of being a bad risk.
An investor might review the following:
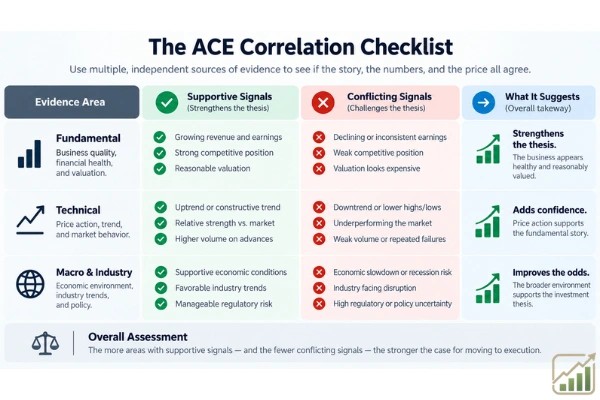
Evidence Area | Supportive Signal | Conflicting Signal |
|---|---|---|
Fundamentals | Improving revenue and cash flow | Falling margins or rising debt |
Valuation | Price appears reasonable for expected growth | Price assumes unusually high growth |
Technical Structure | Stable uptrend and constructive support levels | Breakdown below key support |
Momentum And Volume | Rising participation and improving momentum | Weak demand or deteriorating momentum |
Sector Conditions | Industry demand is improving | Sector faces cyclical or regulatory pressure |
Macro Conditions | Rates, inflation, or growth trends support the thesis | Economic conditions create a headwind |
Catalysts | A credible event could change market expectations | No clear reason for revaluation |
The key word is independent. Seven technical indicators built from the same price history may look like seven signals, but they may be telling you nearly the same thing.
Better correlation comes from comparing different categories of evidence: business performance, valuation, price behavior, sector conditions, and portfolio fit.
A company may have improving earnings, a reasonable valuation, and strong price momentum. If its sector is weakening and a major risk threatens the thesis, the conclusion may be Mixed, not Confirmed.
That doesn't automatically mean “sell” or “avoid.” It means confidence should be lower, position size may need to be smaller, or waiting may be more rational.
For a deeper explanation of how to assess, correlate, and execute investment decisions, focus on the evidence that challenges the thesis as seriously as the evidence that supports it.
Execute: Turn Research Into A Risk-Controlled Decision
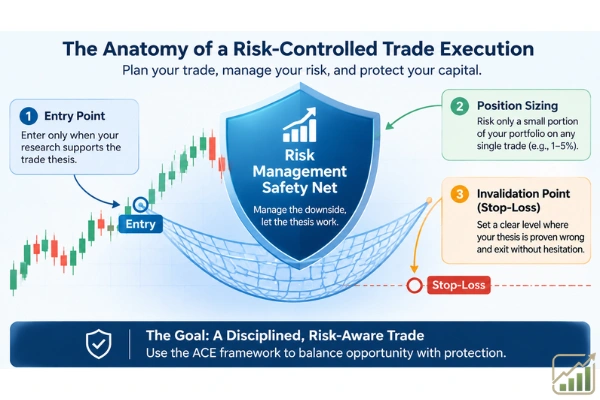
Execute is where analysis becomes an actual investment plan. Many investors do research but don't decide in advance how much they are willing to lose, what would prove them wrong, or when they would add to or reduce a position.
Before executing, define:
Entry approach: Buy now, wait for a price level, or build the position gradually.
Position size: Determine how much of the portfolio belongs in the idea.
Invalidation point: Identify the business, valuation, or price development that would challenge the thesis.
Maximum acceptable loss: Set the downside amount that is tolerable before entering.
Upside case: State what may cause the market to value the investment more highly.
Exit and review rules: Decide when to reassess, trim, sell, or hold.
Execution does not always mean buying. A valid execution decision may be Pass because the opportunity does not meet the required standard. It may be Wait because the company is attractive but the price, risk, or market environment is not.
A disciplined plan does not make an investment risk-free. It makes the risk visible before emotion has a chance to rewrite the rules.
Most investors plan for the moon; the ACE Method plans for the crash. That’s why ACE investors keep their profits while others bleed.
How To Apply ACE To An Investment Decision
Start With Your Portfolio Before The Ticker Symbol
ACE works best when it begins with the investor’s actual objective. A retirement investor with a short time horizon may need a different level of stock exposure than an investor saving for a goal decades away.
The same company can be appropriate for one portfolio and unsuitable for another because of concentration, income needs, or tolerance for volatility.
Start by writing down the role the investment would serve:
• Long-term growth holding
• Dividend or income position
• Smaller speculative allocation
• Sector diversification tool
• Shorter-term trade with defined risk
This prevents a common failure: analyzing an investment in isolation while ignoring whether the portfolio already has too much exposure to the same company, sector, or economic risk.
Use A Simple ACE Research Record
An ACE worksheet does not need to be complicated. Its value comes from forcing a visible record of the decision before money is committed.
Stage | Questions To Record | Decision Output |
|---|---|---|
Assess | What is the business case? What are the largest risks? Does this fit the objective? | Reject, Watch, or Investigate |
Correlate | Which facts support the thesis? Which facts contradict it? Are signals independent? | Weak, Mixed, or Confirmed |
Execute | What is the entry, position size, risk limit, and invalidation point? | Pass, Wait, or Execute |
For instance, imagine an investor researching a semiconductor company. The assessment may show strong revenue growth and a healthy balance sheet.
Correlation may reveal that valuation is high, momentum is positive, but the sector is already a large portion of the portfolio.
Execution might lead to a smaller position, a staged purchase, or a decision to wait for a better risk and reward setup.
That is not hesitation for its own sake. It is the method working as intended.
Review Decisions After The Outcome Is Known
A trade journal or investment journal is useful because a profitable decision can still be poorly executed, and a losing decision can still follow a sound process. Markets sometimes reward weak reasoning in the short run. They also sometimes punish strong reasoning when unexpected events occur.
Review these questions after a meaningful period:
• Did the original assessment identify the major risk?
• Did the correlation stage overlook conflicting evidence?
• Was the position size appropriate for the uncertainty involved?
• Did the execution rules change because of new facts or because of emotion?
• Would the same decision be made again with the information available at the time?
For broader investment process insights, focus on improving the decision record rather than judging every choice solely by a single outcome.
Benefits, Limits, And Comparisons
Where ACE Can Help
The practical advantage of ACE is separation. Investors often move from attention to conviction to action in minutes. ACE creates pauses between those steps.
Assess can reduce impulse decisions. Correlate can reduce confirmation bias by requiring contradictory evidence to be considered. Execute can reduce emotional reactions because entry, sizing, and exit logic are considered in advance.
This can be especially useful for self-directed investors who consume a large amount of market content. More information does not automatically create better decisions. Without a framework, it can simply create more reasons to act too quickly.
Where ACE Has Limits
ACE is not a substitute for diversification, asset allocation, emergency savings, or a realistic retirement plan. It also cannot solve the underlying uncertainty of investing.
A process can fail when:
• Financial data is outdated, incomplete, or misunderstood
• Signals that appear independent are actually driven by the same market trend
• A rigid checklist causes an investor to ignore new information
• Position sizing is too aggressive for the investor’s true risk tolerance
• The investor treats a “Confirmed” score as certainty rather than a probability judgment
The framework requires honest inputs. If an investor uses the correlation stage only to build a case for a stock they already want to own, the process becomes a form of confirmation bias with better formatting.
Comparing ACE With Other Approaches
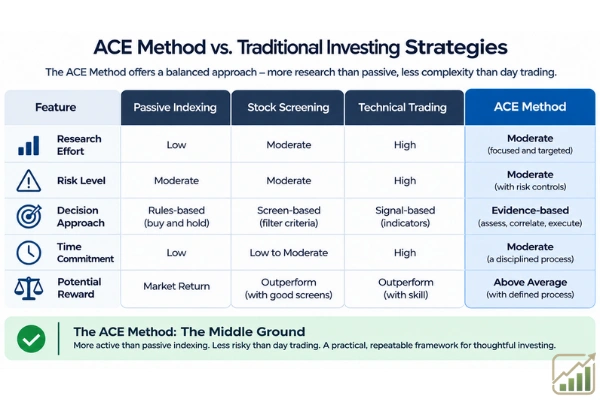
Approach | Main Focus | Strength | Main Limitation |
|---|---|---|---|
ACE Method™ | Structured decision process | Connects research, portfolio fit, and execution | Requires consistent recordkeeping and judgment |
Passive Index Investing | Broad market exposure | Low complexity and broad diversification | Does not address individual stock selection or timing decisions |
Stock Screening | Finding candidates by metrics | Efficient starting point for research | Metrics alone may miss valuation, context, and portfolio risk |
Technical Trading | Price, trend, and market behavior | Can provide disciplined entry and exit structure | May underweight business fundamentals |
Active Portfolio Product | Professional or rules-based management | May provide defined strategy and oversight | Fees, holdings, performance, and suitability must be reviewed |
Some ACE-labeled products demonstrate why investors must look beyond the acronym. An ACE basket brochure describes portfolios of approximately 7 to 12 companies and classifies businesses as capital compounders, eroders, destroyers, or imploders. A basket with that number of holdings can still involve significant concentration risk, even if the selection process sounds disciplined.
Likewise, an ICICI Direct ACE Equity Portfolio presentation describes limits of 10% per stock and 40% per sector, with stated exposure ranges of 60% to 100% in large-cap stocks and 0% to 40% in mid- and small-cap stocks. Those numbers describe a particular portfolio presentation, not a universal rule for every ACE approach.
Another ACE trading description uses trend-aligned long and short positions, sector rotation, and automated entries and exits. That is materially different from a long-term, long-only investor using ACE as a research and risk-management framework.
No available independent evidence establishes that ACE-labeled approaches consistently outperform a U.S. benchmark after fees, taxes, and risk adjustment. That does not make a disciplined process useless. It means performance claims should be examined with the same skepticism applied to any strategy: request the benchmark, full time period, fees, drawdowns, turnover, and whether results are audited or hypothetical.
For investors working to improve a retirement plan, strategies for those behind on retirement savings should begin with savings rates, account choices, asset allocation, and realistic goals before adding individual-stock research.
Frequently Asked Questions
What Does ACE Stand For In The ACE Method For Investing?
In the Execution Signals ACE Method™, ACE stands for Assess, Correlate, Execute. Assess determines whether an opportunity deserves research, Correlate tests whether the evidence agrees, and Execute defines how to act while managing risk.
Is The ACE Method A Standardized Investment Strategy?
No. ACE is used by different organizations for different frameworks, products, and strategies. The Assess, Correlate, Execute version is a decision system for investors. Always verify what a particular provider means by ACE before evaluating its claims.
Is ACE Active Investing Or Passive Investing?
ACE can support either approach, but it is most directly useful when an investor is making active decisions about individual stocks, ETFs, position sizing, or portfolio changes.
A passive investor can still use ACE when evaluating asset allocation changes, fund choices, or whether to avoid emotional selling.
Does The ACE Method Use Fundamental Or Technical Analysis?
It can use both. Assess often emphasizes business quality, financial health, valuation, and risks. Correlate may compare those findings with technical structure, momentum, volume, sector trends, and macro conditions. The goal is not to treat one indicator as decisive.
Does A Confirmed ACE Setup Mean I Should Buy?
No. A Confirmed result means the evidence appears to align sufficiently to consider action. Execution still requires an appropriate entry, position size, risk limit, and portfolio fit. A confirmed thesis can still be unsuitable at the current price or within an already concentrated portfolio.
Can The ACE Method Guarantee Better Returns?
No investment process can guarantee returns or prevent losses. ACE is intended to improve decision quality and consistency by making assumptions, risks, and execution rules explicit. Better process discipline does not eliminate uncertainty.
How Should A Beginner Start Using ACE?
Begin with one investment idea and a simple written worksheet. Record the business case, valuation concerns, key risks, evidence for and against the thesis, intended position size, and the event that would invalidate the idea. Start small, review the decision later, and improve the process before increasing complexity.
Sources And References
Vanguard Canada — Unlocking better outcomes with behavioral design: https://www.vanguard.ca/en/insights/unlocking-better-outcomes-with-behavioral-design
Investmentz — ACE basket brochure: https://uat.investmentz.com/images/ACMIIL-ibasket-Brochure.pdf
ICICI Direct — ACE Equity Portfolio presentation: https://secure.icicidirect.com/content/staticdata/PMS/Strategies/Strategy_ISECACE/OtherFiles/Presentation.pdf