

ACE Method: How Assess Correlate Execute Improves Investing
How Assess Correlate Execute improves investment decisions comes down to one practical change: it separates research from belief and belief from action.
Instead of moving from an interesting stock headline directly to a buy order, I recommend treating each step as a different decision with its own evidence, limits, and output.
How Assess Correlate Execute Improves Investment Decisions
Assess: Decide Whether An Opportunity Deserves Attention
Build A Decision Record Before Forming A Conclusion
Define What Would Disprove The Idea
Correlate: Test Whether The Evidence Supports Risk Taking
Use Independent Evidence, Not Repeated Versions Of One Opinion
Test Portfolio Fit Before You Buy
Execute: Turn A Thesis Into A Controlled Decision
Translate Analysis Into A Trade Or Investment Plan
Account For Friction And Operational Risk
Measure Process Quality, Not Just Returns
What Does Assess Correlate Execute Mean In Investing?
Does Correlate Mean Statistical Correlation?
What Should I Assess Before Buying A Stock?
How Does ACE Reduce Emotional Investing?
Can ACE Be Used For ETFs, Options, Or Cryptocurrency?
How Should I Decide Position Size Under ACE?
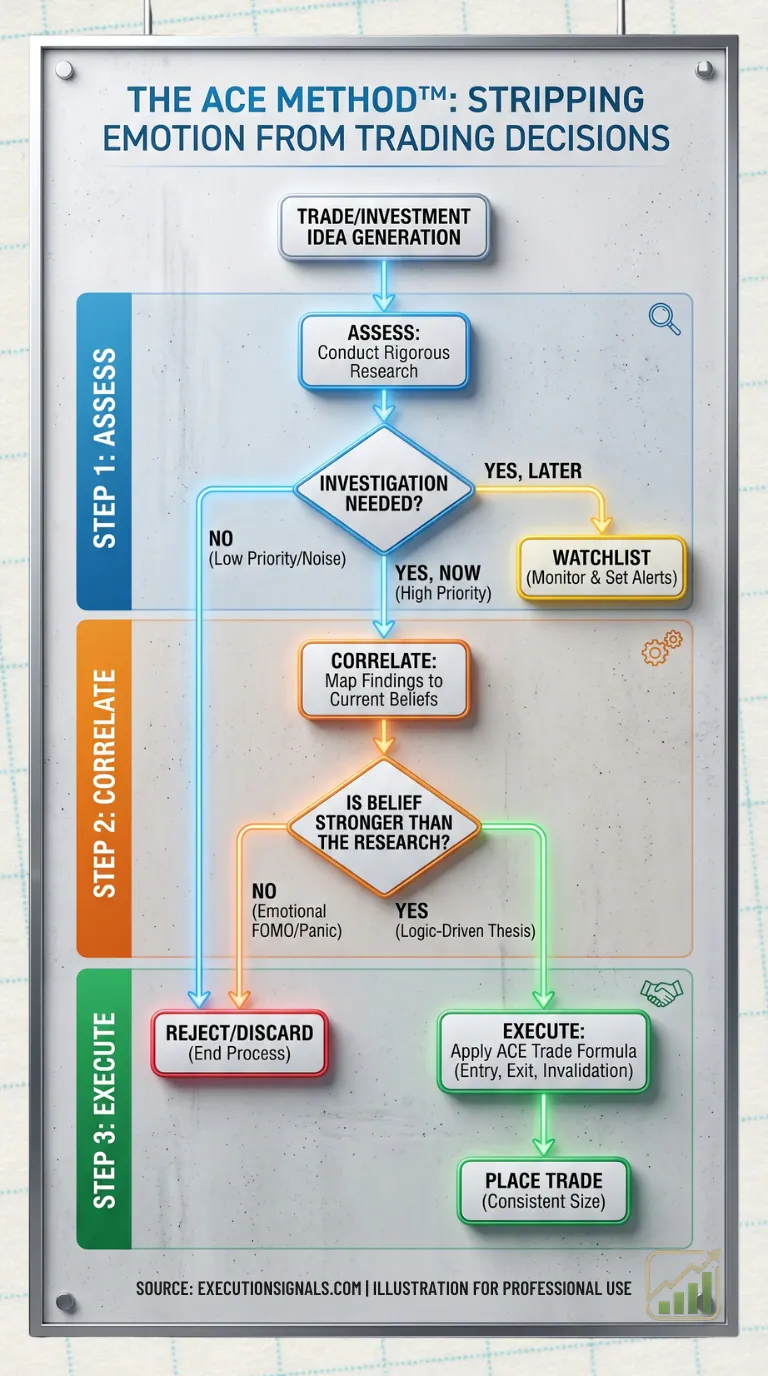
Assess: Decide Whether An Opportunity Deserves Attention
The Assess stage solves the first decision problem:
Is this investment opportunity worth investigating?
This is a qualification step, not a buy signal. A company can be well run, widely admired, and still be a poor fit for an investor’s goals or too expensive at the current price. On the other hand, a low priced stock may look cheap because its business is weakening. Assessment helps separate a possible opportunity from noise.
Execution Signals describes the ACE Method™ as a process that assesses the business and opportunity, correlates chart structure, risk and reward, position size, catalysts, and portfolio fit, then executes a plan. That framework is outlined in its ACE Method™ investment evaluation overview.
Build A Decision Record Before Forming A Conclusion
I would begin assessment with a short written record. The purpose is not to predict a stock’s future price. It is to make the reason for attention visible enough to test.
A useful assessment record includes:
• Business quality: What does the company sell, who pays for it, and what could weaken demand?
• Financial health: Are revenue trends, margins, debt, cash flow, and dilution consistent with the story?
• Valuation context: What must go right for the current price to make sense?
• Competitive position: Does the company have an advantage, or is it operating in a crowded market?
• Catalysts and risks: What events could change market expectations, and what could break the thesis?
• Investor fit: Does the idea match the investor’s timeline, objectives, and tolerance for loss?
The output should be simple: Reject, Watch, or Investigate Further. That prevents an early opinion from becoming a commitment.
A Hypothetical Stock Example
Consider a fictional company called Northstar Components. It makes power management equipment used in data centers. Its revenue has grown for several quarters, management expects demand from new infrastructure projects, and margins have improved. Those facts may justify further work.
But assessment also reveals two complications. The stock is trading at a valuation that assumes continued rapid growth, and one major customer represents a meaningful share of revenue. Neither fact automatically disqualifies the stock. Together, they change the question.
The investor should not ask, “Is Northstar a good company?” The better question is, “Is the possible return sufficient for the risks that are already visible?”
That distinction matters most for people trying to catch up on long term goals. A disciplined research process can complement broader retirement planning, including a review of the Late Start Retirement Guide. Investment selection is only one part of readiness, but poor decisions can compound an existing savings gap.
Define What Would Disprove The Idea
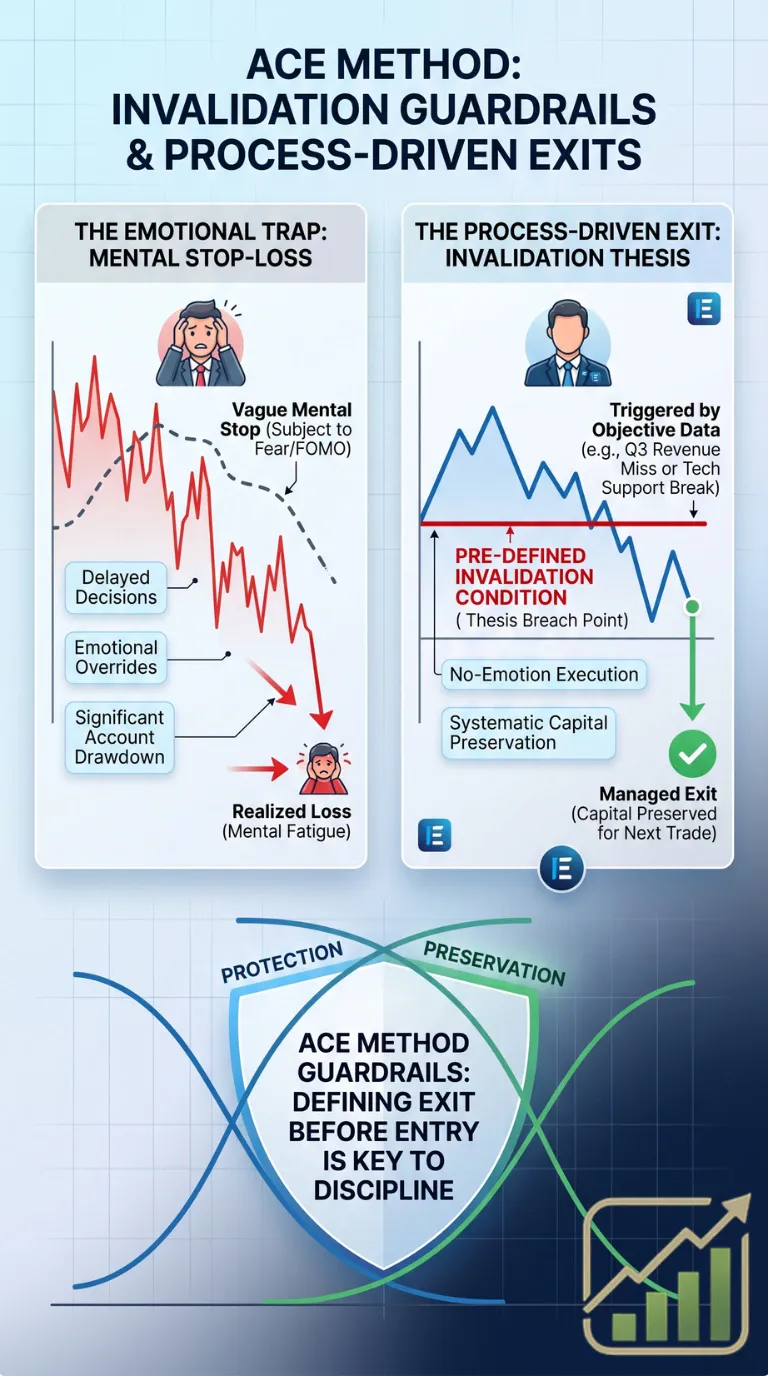
Every assessment should include an invalidation condition. This is the evidence that would require the investor to revise or abandon the thesis.
For Northstar Components, invalidation might include:
Revenue growth falling below the level needed to support its valuation.
A key customer reducing orders materially.
Gross margin deterioration that suggests pricing pressure.
New information showing that industry demand was pulled forward rather than expanding.
This is not a guarantee that losses will be avoided. It is a guardrail against a common error: continuing to defend an idea after its original reason for ownership has disappeared.
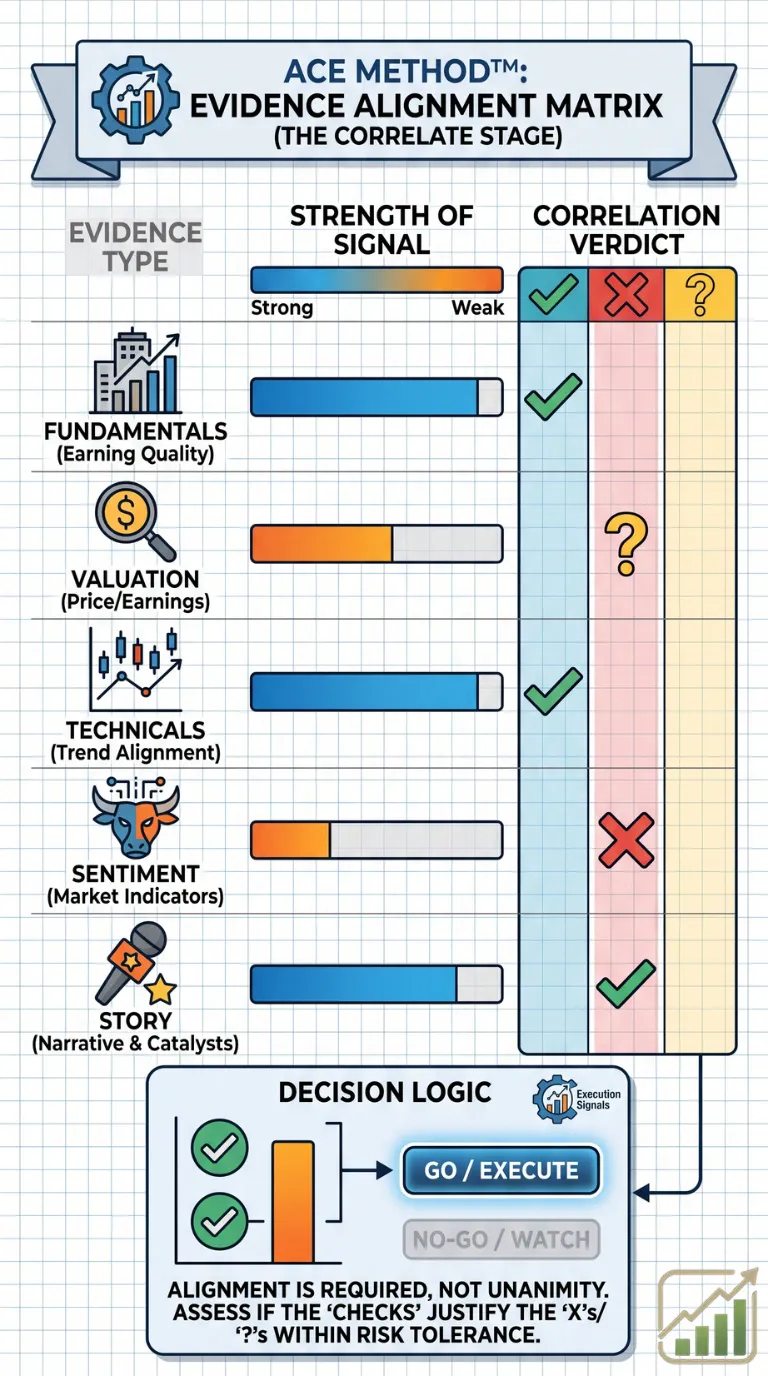
Correlate: Test Whether The Evidence Supports Risk Taking
The Correlate stage answers a different decision problem:
Does enough independent evidence agree to justify taking risk?
In ACE, correlate should not be confused with statistical correlation alone. Statistical correlation measures how two assets moved relative to each other in the past. That can be useful for portfolio management, but it is only one type of relationship.
Here, correlation also means evidence alignment. Fundamentals, valuation, price behavior, industry conditions, catalysts, risk, and existing portfolio exposure should be examined together. The aim is not perfect agreement. Markets rarely offer that. The aim is to identify whether the evidence is confirmed, mixed, or weak.
Use Independent Evidence, Not Repeated Versions Of One Opinion
A stock screener can generate dozens of signals that appear different but are driven by the same underlying factor. For example, rising price, positive momentum, and a new 52 week high may all reflect the same price trend. Counting each as separate confirmation can create false confidence.
I would group evidence into distinct categories instead:
Evidence Category | Question To Ask | Northstar Example |
|---|---|---|
Fundamentals | Is the business improving? | Revenue and margins are rising. |
Valuation | Is the price reasonable relative to expectations? | Expectations appear demanding. |
Technical structure | Does price behavior support the thesis? | The stock holds above a prior support area. |
Catalyst | What could change investor expectations? | New data center contracts may matter. |
Industry and macro conditions | Is the broader setting helpful or harmful? | Infrastructure spending is supportive, but rates remain a risk. |
Portfolio fit | Does this duplicate an existing exposure? | The investor already owns several technology related holdings. |
Northstar may earn a Mixed result rather than Confirmed. Fundamentals and industry conditions support the idea, but valuation and concentration concerns reduce conviction. That is a useful result. A process that identifies uncertainty before capital is committed is working as intended.
Test Portfolio Fit Before You Buy
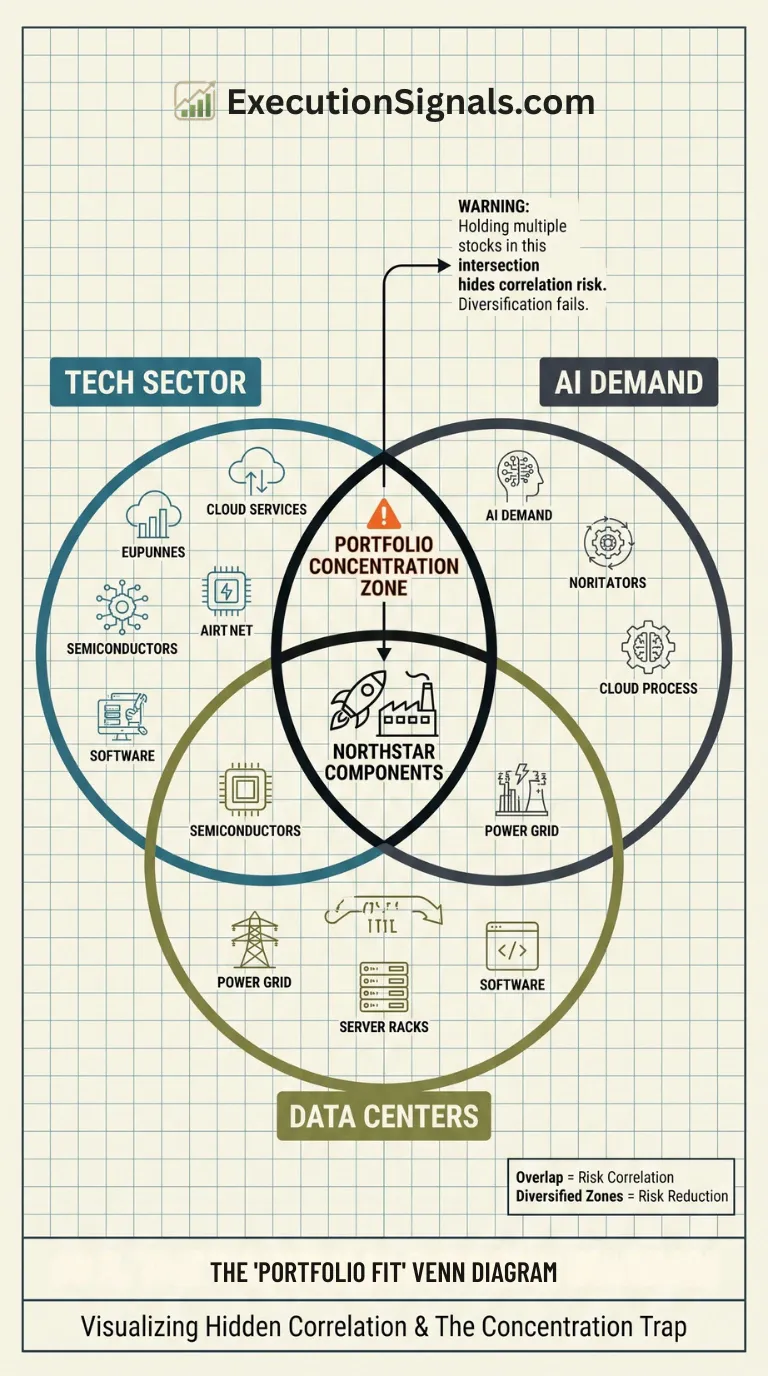
Portfolio fit is where many otherwise sensible stock ideas become riskier than they look. A portfolio can hold several different tickers yet still be heavily exposed to one sector, interest rate sensitivity, customer base, commodity, or economic theme.
Before executing, compare the proposed position with current holdings:
• Does it increase exposure to the same sector or industry?
• Does it depend on the same economic outcome as other positions?
• Does it share suppliers, customers, or a common technology trend?
• Would several holdings likely decline together during a market shock?
For example, Northstar may not be an appropriate addition if a portfolio already owns data center operators, semiconductor firms, and cloud infrastructure companies. The names differ, but the underlying bet may be similar: continued investment in data infrastructure.
This does not mean every overlap must be avoided. It means the investor should know when a new purchase is adding diversification and when it is increasing concentration. For investors who are worried about a shortfall, resources such as Behind on Retirement Savings can help place investment risk inside a broader savings and spending plan.
Correlation Is Not Proof
Strong evidence alignment can improve the quality of a decision, but it cannot prove an outcome. A favorable chart, compelling earnings trend, and industry tailwind can all be present before an unexpected event changes the picture.
This is especially important for systematic strategies. Historical results may look convincing because rules were adjusted to match past data. A review of practical strategy validation and execution constraints notes that spreads, slippage, financing, borrow costs, market impact, capacity limits, and validation design can materially change real world results.
The lesson is straightforward: a back test or correlation study is a starting point, not a promise. If rules are designed from historical data, test them on data that was not used to create them. Also test whether small changes to assumptions produce dramatically different results. A process that works only under one precise set of inputs may be fragile.
Execute: Turn A Thesis Into A Controlled Decision
The Execute stage answers the final decision problem:
Given the evidence, what action best expresses the thesis while controlling downside?
Execution is not simply clicking Buy. It converts a thesis into specific instructions that can be followed when price movement and headlines become emotionally difficult.
The output is Pass, Wait, or Execute.
A Pass means the risk does not justify action. A Wait means the thesis may be sound, but the entry, catalyst, or portfolio conditions are not ready. Execute means the investor has defined the intended position, risk limit, and review process before placing an order.
Translate Analysis Into A Trade Or Investment Plan
For the fictional Northstar example, an execution plan could look like this:
Plan Element | Example Decision | Why It Matters |
|---|---|---|
Entry condition | Buy only if the stock remains above a defined support zone after earnings. | Avoids buying before a known event changes the thesis. |
Position size | Limit the initial allocation to a modest portion of the portfolio. | Keeps one idea from dominating total risk. |
Invalidation level | Reduce or exit if price weakness is confirmed alongside weaker business results. | Connects the exit decision to the thesis, not panic alone. |
Upside review | Reassess if the stock reaches a valuation that assumes unusually high growth. | Avoids treating a rising price as automatic proof. |
Time horizon | Review after the next two earnings reports or a major industry update. | Creates a planned point for reassessment. |
A stop loss can be part of this plan, but it should not replace analysis. A price level alone does not explain whether the business case changed, whether the position was too large, or whether the portfolio remains concentrated.
Account For Friction And Operational Risk
Execution quality is often overlooked because it feels less interesting than finding a stock. Yet a sound thesis can be weakened by poor order handling, unexpected costs, or buying power errors.
For less liquid securities, a market order may fill at a worse price than expected. For active strategies, frequent trades can add spreads, commissions where applicable, slippage, taxes, and opportunity costs. Options and short positions introduce additional complexities such as expiration, borrow availability, and financing charges.
A decision process should also distinguish investment opinion from operational controls. An implementation example involving risk checks and order sequencing describes checking proposed target weights against limits, available cash, custody constraints, and turnover budgets before orders are generated. It also illustrates why selling first and refreshing buying power before purchases can matter.
For an individual investor, the equivalent may be simple:
Confirm available cash and current holdings.
Confirm the intended position size still fits the portfolio.
Choose an order type appropriate for the security’s liquidity.
Record the planned entry, invalidation condition, and review date.
Check the actual fill against the planned price and document the difference.
That final step measures implementation shortfall: the gap between the price expected when the decision was made and the economic result actually achieved. A repeated gap may signal that order timing, liquidity, or sizing rules need improvement.
Measure Process Quality, Not Just Returns
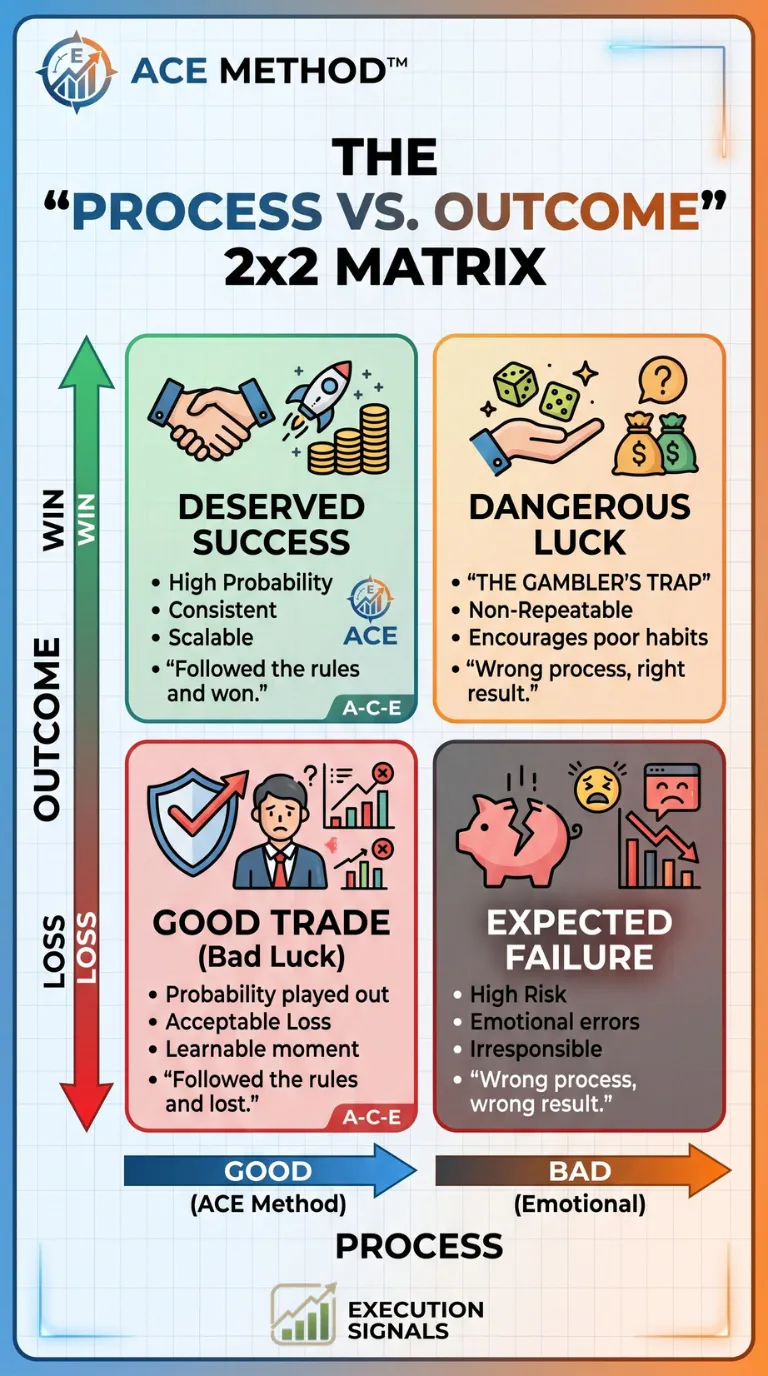
ACE can improve decision quality without guaranteeing superior returns. There is no identified primary study showing that the branded ACE Method™ produces higher returns, a better Sharpe ratio, or smaller drawdowns than a defined alternative. It should be treated as an educational decision framework, not as a performance promise.
Still, investors can measure whether their process is improving. Track:
• The percentage of decisions with a written thesis before purchase.
• The percentage with a defined invalidation condition and position size.
• Portfolio concentration before and after each purchase.
• Actual trading costs and implementation shortfall.
• Turnover, realized gains and losses, and maximum drawdowns.
• Whether exits occurred because the thesis changed or because the original plan was ignored.
A trade that loses money may still represent a good process if the position was sized appropriately and the invalidation rule was followed. A profitable trade can reflect poor process if it relied on oversized risk or luck. Over time, this distinction is essential.
Key Takeaways
• Assess asks whether an opportunity deserves further attention, not whether it should be bought immediately.
• Correlate checks whether independent evidence, portfolio exposure, and risk considerations align strongly enough to justify risk.
• Execute turns the thesis into position sizing, entry rules, invalidation criteria, and order controls.
• The framework may improve discipline and decision consistency, but it does not guarantee investment outperformance.
• For retirement focused investors, investment decisions work best when reviewed alongside savings rates, timelines, and a Retirement Readiness Checklist.
Frequently Asked Questions
What Does Assess Correlate Execute Mean In Investing?
Assess Correlate Execute is a structured decision process. Assess determines whether an investment idea deserves research. Correlate tests whether business, valuation, technical, catalyst, risk, and portfolio evidence align. Execute defines whether to pass, wait, or act with specific risk controls.
Does Correlate Mean Statistical Correlation?
Not only. Statistical correlation can help show how a stock has moved relative to another asset or index. In ACE, correlate also means connecting different forms of evidence and checking portfolio overlap. A stock can have low statistical correlation with a holding but still share the same economic risk.
What Should I Assess Before Buying A Stock?
Assess the business model, financial health, valuation, competitive position, likely catalysts, major risks, and fit with your objectives. Also write down what evidence would invalidate the thesis. If you cannot explain why you would sell or reduce the position, the analysis is incomplete.
How Does ACE Reduce Emotional Investing?
ACE moves key decisions earlier. Position size, risk limits, entry conditions, and review points are considered before money is at risk. That does not remove emotion, but it can reduce the need to improvise after a sharp price move.
Can ACE Be Used For ETFs, Options, Or Cryptocurrency?
Yes, with adjustments. For ETFs, assessment should focus on holdings, fees, concentration, and the index methodology. For options, include expiration, volatility, and time decay. For cryptocurrency, assess custody, liquidity, regulatory uncertainty, and extreme price volatility. The risk controls should reflect the asset’s unique behavior.
How Should I Decide Position Size Under ACE?
Position size should reflect how much capital you can reasonably risk if the thesis fails, not only how confident you feel. A highly uncertain or volatile idea generally calls for a smaller allocation. Avoid using a large position to compensate for being behind on a financial goal.
How Can I Tell Whether The Process Is Working?
Review a decision journal over a meaningful period. Look for better adherence to written plans, fewer impulsive trades, clearer reasons for exits, reduced unwanted concentration, and realistic estimates of trading costs. Separate process quality from short term returns.
Sources
Execution Signals + Stop Loss Calculator for Stocks | Execution Signals: https://executionsignals.com/tools/stop-loss-calculator
Simons’ Strategies: Renaissance Trading Unpacked | LuxAlgo Blog: https://www.luxalgo.com/blog/simons-strategies-renaissance-trading-unpacked/