
Don't Buy Until You Use This Stock Assessment Checklist
Use this stock assessment checklist for individual investors to evaluate business quality, finances, valuation, risks, and portfolio fit before buying.
A reliable stock assessment checklist for individual investors should do more than collect ratios. It should help you decide whether to reject a stock, research it further, wait for better conditions, or build a position with a defined plan.
I use a staged approach because a strong company, an attractive valuation, and a suitable portfolio position are three different decisions.
A stock can pass one test and fail another. A profitable company may carry too much refinancing risk. A fast growing business may already be priced for near perfect execution.
A reasonably valued stock may still be a poor fit if it increases your exposure to one sector or creates a position too large to hold through normal volatility.
The goal is not to predict every price move. The goal is to make a decision you can explain, test, and revisit when new evidence appears.
Table Of Contents
Assess The Business And Financial Foundation
Correlate Valuation, Risks, And Market Evidence
Assess The Business And Financial Foundation
The Assess stage answers one question: Is this company worth investigating? It is a filter, not a buy signal. If you cannot describe how the company earns money, who pays it, and what could weaken that income, stop before opening a valuation spreadsheet.
FINRA’s stock evaluation guidance supports reviewing products or services, historical performance, management, industry conditions, growth prospects, and business obstacles. Those categories are useful because they prevent a narrow focus on the share price.
Start With A One Page Business Summary
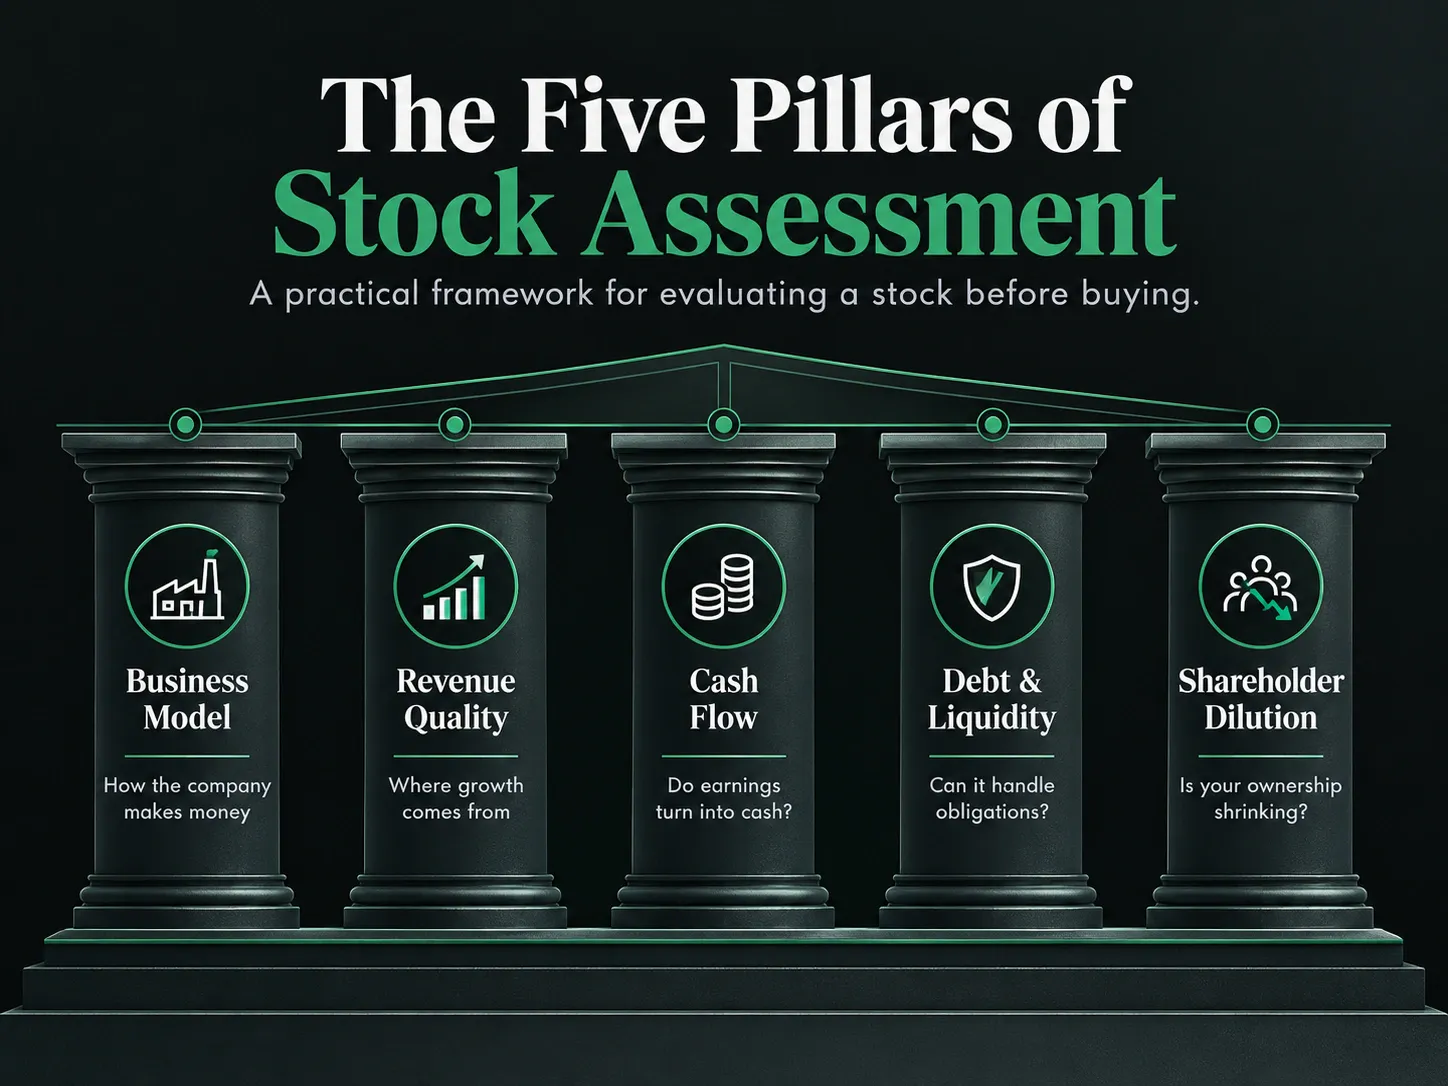
Write the following in plain language. If the answer relies mostly on promotional language from an investor presentation, mark the item as unverified and look for support in the Form 10 K or Form 10 Q.
What does the company sell? Name the main product, service, or platform.
Who pays for it? Identify consumers, enterprises, governments, distributors, or another customer group.
How does it make money? Note recurring subscriptions, transaction fees, product sales, advertising, lending spread, rents, or another revenue source.
What creates demand? Demand might come from cost savings, regulation, brand loyalty, necessity, network effects, or switching costs.
What could disrupt demand? Consider lower priced competitors, customer concentration, new technology, cyclicality, regulation, or changing consumer behavior.
This exercise exposes a common error: confusing a compelling product with an investable business. For example, a popular product can still produce weak returns for shareholders if competition forces prices down or if the company must spend heavily to keep customers.
Use An Evidence Hierarchy
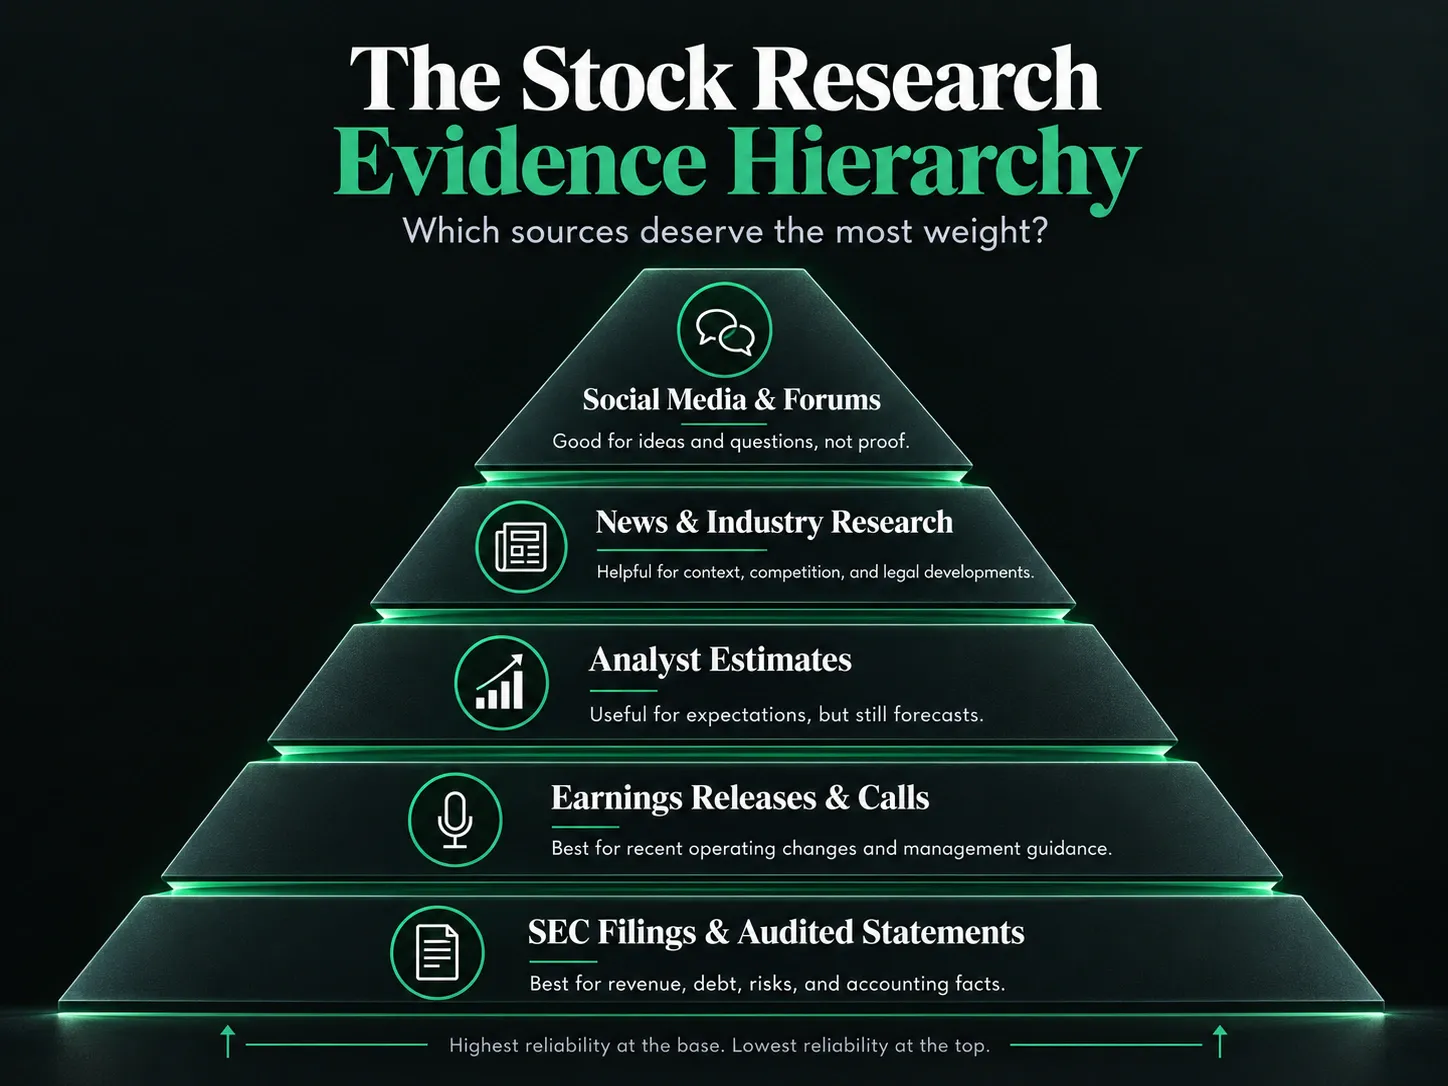
Not all information deserves equal weight. I would generally place audited financial statements and SEC filings above management presentations, then compare management claims with earnings call details and outside reporting.
Analyst estimates can be useful inputs, but they are forecasts, not facts. Social media posts and anonymous forums can generate research ideas, but they should not be the evidence that supports a purchase.
A practical hierarchy looks like this:
Evidence Type | Best Use | Main Limitation |
|---|---|---|
SEC filings and audited statements | Revenue, debt, risks, share count, accounting policies | Can be lengthy and backward looking |
Earnings releases and calls | Recent operating changes and guidance | Management frames the narrative |
Investor presentations | Business model, market opportunity, strategy | Often emphasize favorable metrics |
Analyst estimates | Testing market expectations | Estimates can change quickly |
News and industry research | Competitive, legal, and demand changes | Headlines may lack context |
Forums and social media | Finding questions to investigate | Not reliable proof |
Check Financial Quality, Not Just Growth
Review several years of revenue, operating margin, net income, operating cash flow, capital expenditures, debt, and shares outstanding.
AAII’s checklist discussion for investors supports examining five to seven years of financial trends, comparing valuation ratios, and calculating free cash flow as operating cash flow less capital expenditures.
The multi year view matters because a single strong quarter can result from price increases, an acquisition, a temporary shortage, or easy comparisons with a weak prior period. Look for direction and durability instead of demanding perfect year by year growth.
Use this financial quality check:
• Revenue: Is growth organic, acquisition driven, price driven, or volume driven? The distinction affects how repeatable it may be.
• Margins: Are gross and operating margins steady, improving, or falling? Falling margins can signal cost pressure or weakening pricing power.
• Operating cash flow: Does cash from operations broadly support reported earnings over time?
• Free cash flow: After capital expenditures, does the company produce cash that can support debt reduction, dividends, repurchases, or reinvestment?
• Working capital: Are receivables or inventory growing much faster than sales? That can mean revenue is slow to turn into cash or that goods are not moving as expected.
• Debt and liquidity: Review debt maturities, interest expense, cash balances, and whether operating cash flow appears sufficient during a weaker year.
There is no universal debt ratio that makes every stock safe or unsafe. A utility, bank, software company, and cyclical manufacturer operate with different capital needs.
The more useful question is whether the company can meet obligations without relying on unusually favorable economic conditions or constant new borrowing.
Make Per Share Economics Mandatory
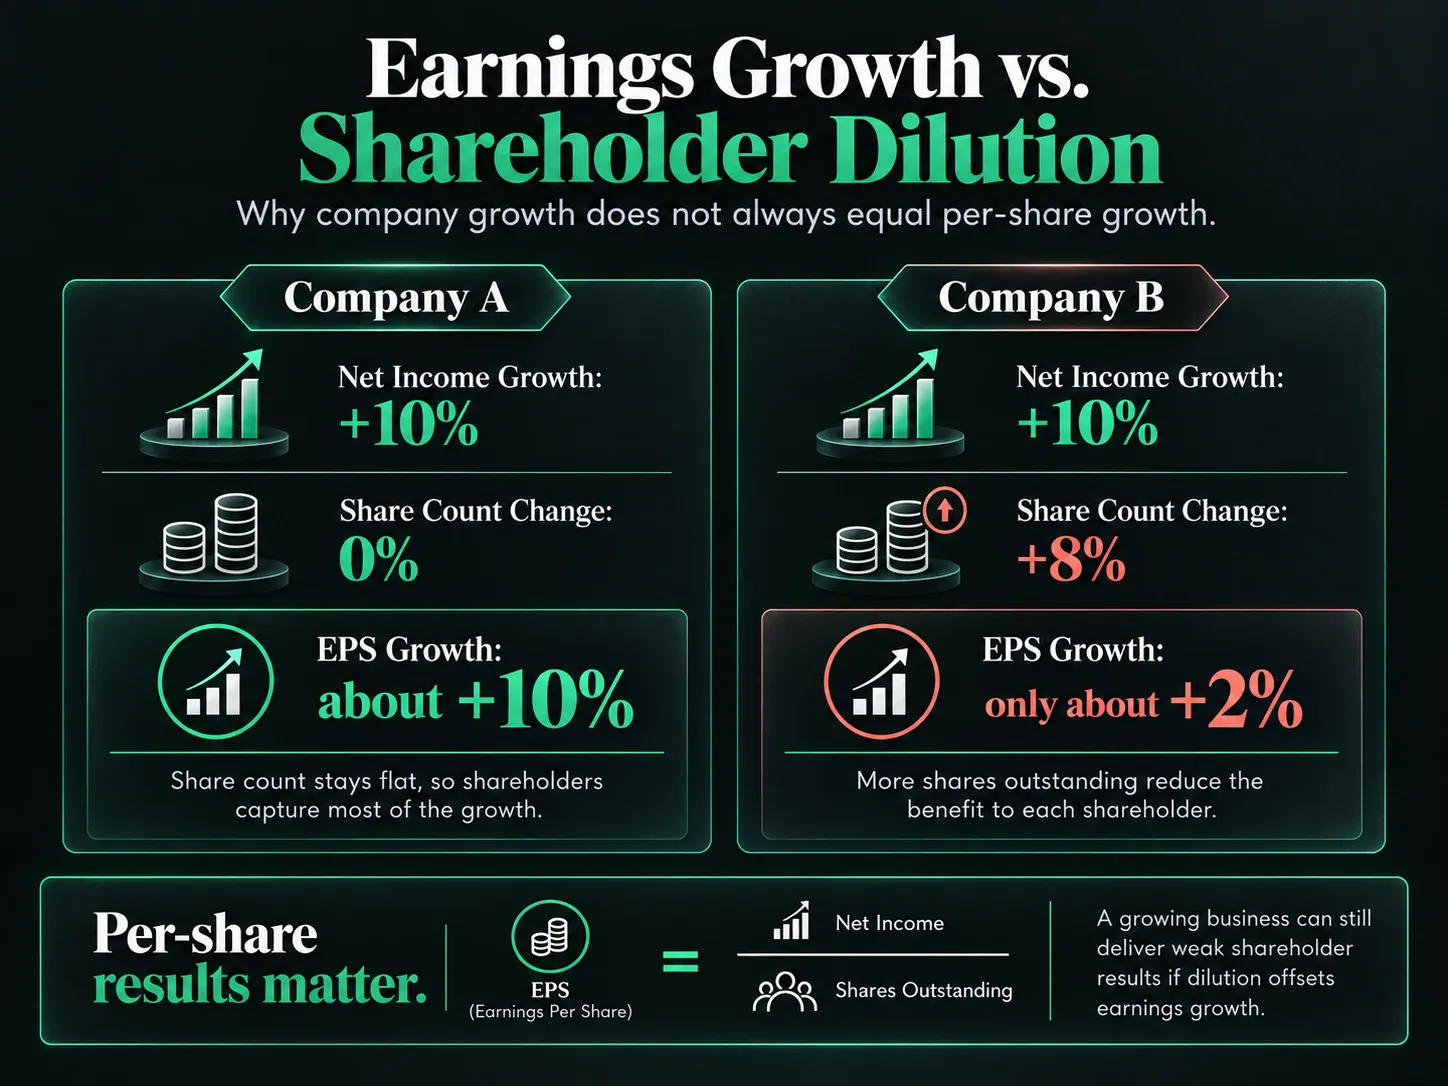
A company can report rising revenue and earnings while each shareholder receives a smaller claim on that progress. Check the weighted average diluted share count and the shares outstanding over time.
Then read notes on stock based compensation, option exercises, convertible securities, acquisitions paid for with stock, and repurchase activity.
Consider two businesses that each grow net income by 10 percent. If Company A keeps its share count flat, earnings per share may also rise about 10 percent. If Company B increases shares by 8 percent, the benefit to each existing share may be far smaller.
Buybacks can offset dilution, but only if the repurchased amount exceeds new issuance over time and the company is not repeatedly buying shares at extreme valuations.
Stop condition: Pause or reject the idea when you cannot explain a large gap between earnings growth and operating cash flow, a sharp rise in receivables or inventory, or persistent dilution with no credible path to stronger per share results.
Correlate Valuation, Risks, And Market Evidence
The Correlate stage asks: Do independent signals support the same conclusion? This is where business quality, valuation, risks, and price behavior are kept separate before being considered together.
A useful next step is to assess, correlate, and execute investment decisions in sequence rather than allowing one attractive metric to override every conflicting fact.
Score The Decision In Separate Buckets
A single overall score can hide the reason a stock is appealing or risky. Score four areas independently using simple labels such as weak, mixed, or strong.
Decision Area | Questions To Answer | What A Weak Result Might Mean |
|---|---|---|
Business quality | Is demand durable? Does the company have an advantage? | Sales may be vulnerable to competition or disruption |
Financial quality | Are cash flow, margins, debt, and share count understandable? | Earnings may be fragile or financing needs may rise |
Valuation | What must happen for today’s price to make sense? | Expectations may already be too demanding |
Portfolio fit | Does this add useful exposure at an acceptable size? | One mistake could affect the portfolio too much |
This separation matters. A high quality company is not automatically a buy. A low P/E ratio is not automatically cheap. It may reflect declining earnings, debt concerns, legal risk, or a business model losing relevance.
Build A Valuation Bridge
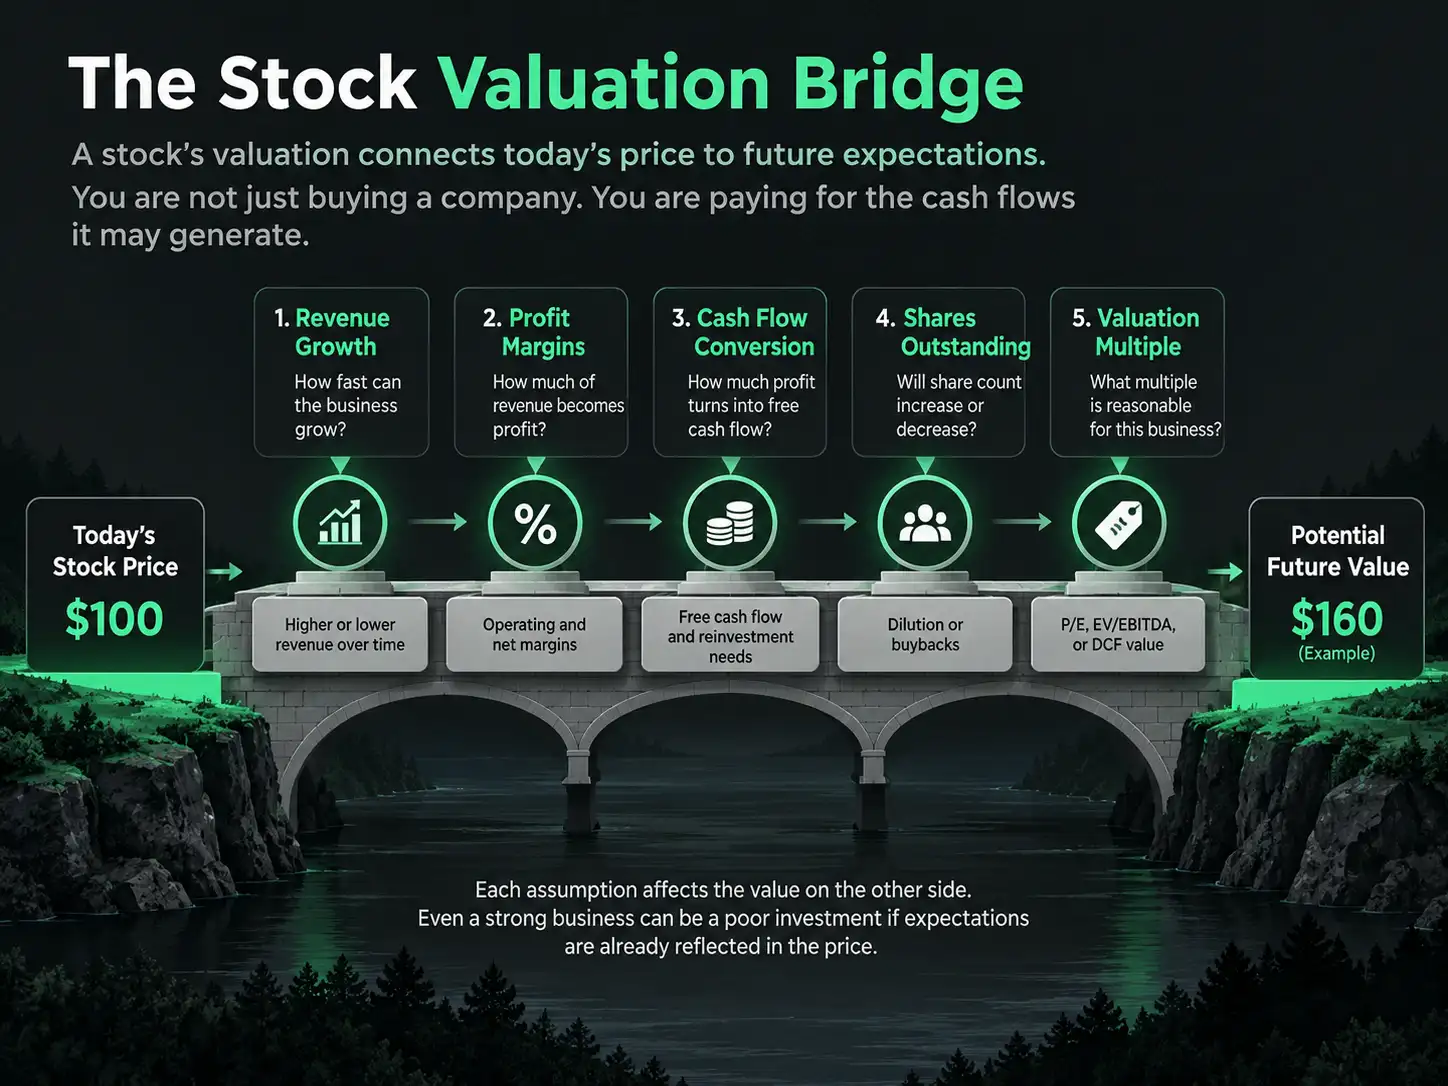
Instead of asking only whether a P/E ratio is lower than a peer’s, write down what the current price appears to assume. This is the valuation bridge.
Start with a reasonable range for revenue growth, operating margin, tax rate, capital expenditures, and share count. Then ask whether the resulting earnings or free cash flow can support the market value.
You do not need a highly complex discounted cash flow model to see the core issue: the price embeds expectations.
For example, suppose a company trades at a premium P/E ratio. That may be justified if revenue can grow at a high rate for years, margins can expand, and dilution remains modest.
But if the company already has high margins, slowing customer growth, and rising stock based compensation, the same multiple may require an overly optimistic outcome.
Compare the stock with true peers, not merely companies in the same broad sector. A peer group should share meaningful traits such as business model, customer type, growth profile, geography, capital intensity, and cyclicality.
A mature retailer is not a clean comparison for a rapidly expanding online marketplace simply because both sell consumer goods.
A community generated value investing checklist highlights working capital, debt maturities, customer retention, implied growth, peer valuation, and downturn resilience.
Those are useful prompts, but they should lead back to primary company disclosures rather than replace them.
Adjust Metrics For The Industry
Using the same ratio set for every company creates false confidence. Choose metrics that match the economics of the business.
• Banks and insurers: Focus more on credit quality, capital strength, underwriting results, funding, and interest rate sensitivity. EBITDA is often not the main tool.
• REITs: Consider funds from operations, property occupancy, lease terms, debt maturities, and interest rate exposure. Standard earnings can include noncash depreciation that needs context.
• Commodity producers: Test balance sheets and cash flow at lower commodity prices. High profits near a price peak may not be normal.
• Early stage companies: Examine liquidity runway, gross margin, customer retention, dilution risk, and the path to sustainable cash generation.
• Asset light software firms: Pay close attention to recurring revenue, retention, customer concentration, sales efficiency, margins, and stock based compensation.
Define Risks And Disconfirming Evidence
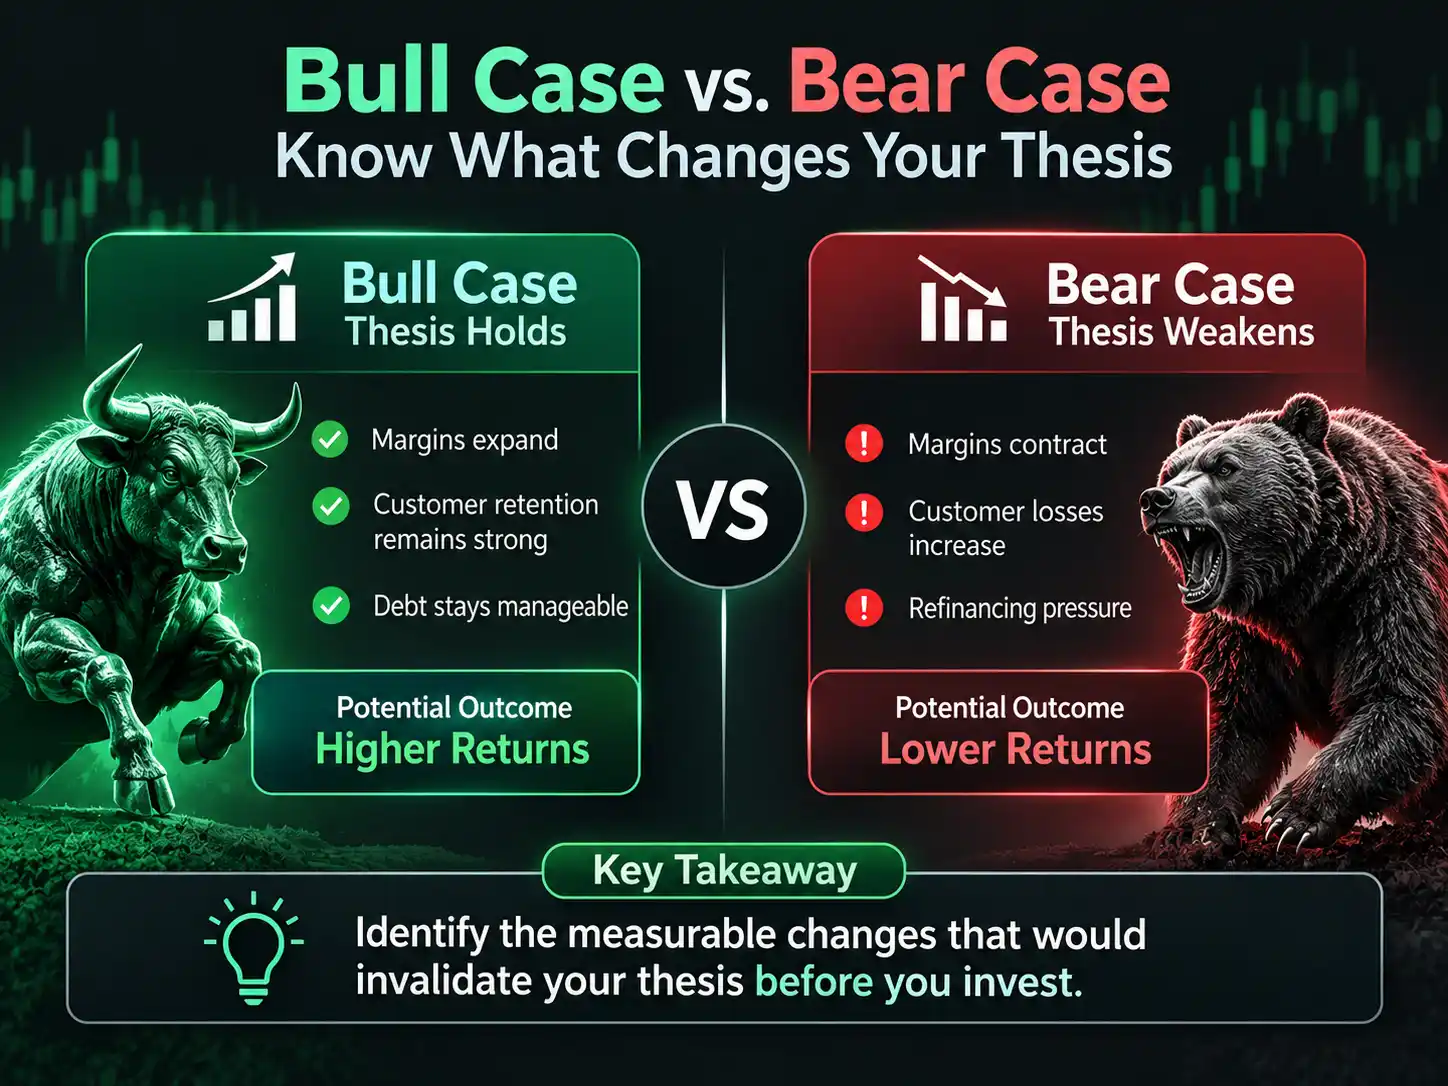
Write the bull case and the bear case before purchasing. Then add specific events or metrics that would weaken the thesis. A practical stock research framework from an investor discussion similarly emphasizes valuation assumptions, disconfirming evidence, outcome ranges, and position or risk management.
Good invalidation conditions are measurable. “The stock falls 20 percent” is usually a price event, not a business reason. Better examples include:
• Customer retention declines for multiple reporting periods.
• Debt refinancing becomes materially more expensive than expected.
• A key product loses market share and management cannot explain the recovery path.
• Margins fall while revenue growth slows, undermining the original operating leverage thesis.
• Share issuance becomes necessary to fund normal operations.
Stop condition: Do not proceed when the price only works under one optimistic scenario, when downside risks are vague, or when you cannot identify what evidence would prove you wrong.
Execute With Position Limits And A Monitoring Plan
Execution answers: What should I do, if anything, and how much risk should I take? Passing research does not require buying immediately. “Wait” is a valid decision when valuation is demanding, the chart is unstable, earnings are near, or the portfolio already has similar exposure.
Match Position Size To The Actual Risk
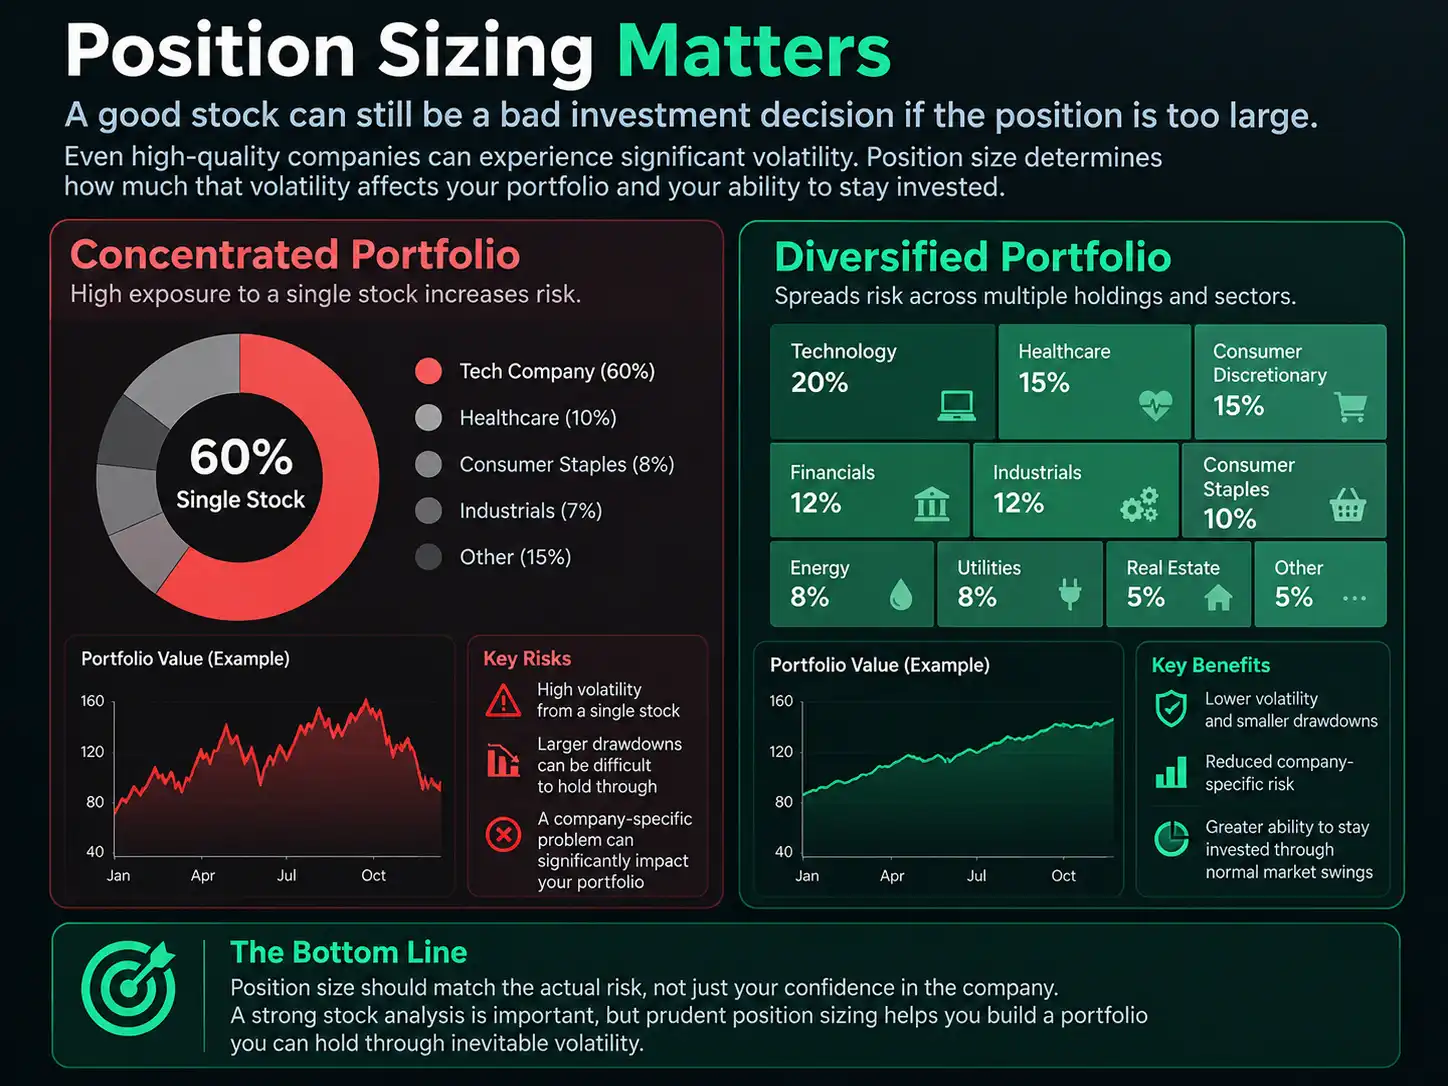
Position sizing should reflect more than conviction. Consider business uncertainty, valuation risk, liquidity, correlation with current holdings, and the amount of loss you could tolerate without making an emotional decision.
For example, two stocks may both appear attractive. One is a large, profitable company with stable cash flow. The other is a smaller company dependent on a single product and future financing. Giving both the same portfolio weight ignores meaningful differences in uncertainty.
Before buying, write down:
The maximum intended portfolio allocation.
Whether the purchase will be made all at once or in planned increments.
The thesis invalidation level and the action it requires.
The expected holding period and the next scheduled review date.
Whether the position overlaps with other holdings by sector, customer base, economic sensitivity, or factor exposure.
Technical analysis can help with timing, trend structure, support and resistance, volume, and volatility. It should not substitute for understanding the business. A favorable chart does not repair weak cash flow, while a weak chart alone does not necessarily invalidate a long term investment thesis.
Plan For Portfolio Friction
Company risk is only part of the decision. Security level and portfolio level issues include bid ask spreads, trading liquidity, taxes, concentration, and correlation.
A thinly traded stock may look attractive on paper, but a wide bid ask spread can increase the real cost of entering or exiting. A taxable account introduces another tradeoff: selling may improve portfolio risk while also realizing gains or losses. That does not mean taxes should control the decision. It means the decision should account for them.
After a purchase, a stock profit and loss calculator can help track share cost, current value, and potential outcomes. Still, profit and loss is not the full review. The key question remains whether the original business and valuation case is strengthening, unchanged, or deteriorating.
Monitor The Thesis, Not Every Price Tick
Set a review schedule that matches the investment. Long term investors may review filings and earnings results quarterly, with a deeper annual review after the 10 K. A more active strategy may require closer monitoring. In either case, define what deserves action.
Review Trigger | Questions To Ask | Possible Action |
|---|---|---|
Quarterly earnings | Did revenue, margins, cash flow, and guidance support the thesis? | Hold, investigate, or reduce |
New debt or equity issuance | Why is capital needed and what changes per share economics? | Recalculate valuation and risk |
Industry or regulatory change | Does the competitive position change? | Revise assumptions or exit |
Major price move | Did facts change or only sentiment? | Avoid automatic reactions |
Portfolio concentration | Has appreciation made the position too large? | Rebalance or set a limit |
For investors rebuilding retirement savings later in their careers, capital preservation can deserve added weight. The catch-up investor's guide offers a useful starting point for thinking about the tradeoffs between growth, time horizon, and risk capacity.
Key Takeaways
• A stock assessment checklist should produce a decision, not just a stack of ratios.
• Separate business quality, financial quality, valuation, and portfolio fit so one strength does not hide a serious weakness.
• Review multi year trends in sales, profits, cash flow, debt, and diluted share count. Per share results matter.
• Use a valuation bridge to identify the growth, margins, and cash generation implied by the current share price.
• Define stop conditions before buying. Unexplained cash flow gaps, refinancing pressure, persistent dilution, and an unclear thesis are reasons to pause.
• Match metrics to the sector. A one size fits all ratio screen can mislead.
• Write measurable thesis invalidation conditions and a monitoring schedule before capital is at risk.
• A well researched stock can still be the wrong position size or the wrong fit for your asset allocation.
Frequently Asked Questions
What Should An Individual Investor Check Before Buying A Stock?
Check the business model, customer demand, financial trends, cash flow, debt, dilution, valuation, risks, competitive position, and portfolio fit. Start with the company’s filings and use a staged process: assess whether the business deserves research, correlate the evidence, then decide whether to execute, wait, or pass.
Which Financial Statements Should I Review First?
Start with the income statement, balance sheet, and cash flow statement in the annual report. Then compare the most recent quarterly filing with the prior period. Look for whether revenue, margins, debt, and cash flow tell a consistent story. Notes to the financial statements often explain share issuance, debt terms, accounting changes, and customer concentration.
How Many Years Of Financial History Should I Examine?
Five to seven years is a useful starting range when available, especially for revenue, profits, operating cash flow, capital expenditures, debt, and shares outstanding. A shorter history may be all that exists for a newer public company, but that raises uncertainty and may call for a smaller position or no position.
How Can I Tell If Earnings Are Supported By Real Cash Flow?
Compare net income with operating cash flow over several periods. Investigate large, persistent gaps. Rising receivables, inventory growth, capitalized costs, or repeated adjusted earnings add backs may explain why reported profit is not becoming cash. A temporary difference can be normal; a recurring unexplained difference deserves caution.
Which Valuation Metric Is Best For Comparing Stocks?
There is no single best metric. P/E can help with mature profitable companies. Enterprise value to EBITDA may help compare operating businesses with different debt levels, though it has limits. Price to sales can be relevant for unprofitable growth businesses but says little about future margins. Use the metric that fits the business, then test the assumptions behind it.
How Do I Identify Dilution Before It Hurts Per Share Returns?
Track diluted weighted average shares and shares outstanding over several years. Read disclosures for stock based compensation, options, restricted shares, convertibles, acquisitions paid with stock, and repurchases. Focus on the net change. Revenue growth is less valuable to an investor if the ownership claim attached to each share keeps shrinking.
What Should I Monitor After Buying The Stock?
Monitor the measures that support the original thesis: revenue drivers, margins, cash flow, debt, customer retention, share count, competitive changes, and valuation. Review after earnings and when a material event occurs. A price decline alone does not prove the thesis is broken, but a change in the underlying facts may require action.
Sources And References
• FINRA — Evaluating Stocks: https://www.finra.org/investors/investing/investment-products/stocks/evaluating-stocks
• AAII — A Checklist Can Make You a Better Investor: https://www.aaii.com/investor-update/article/A-Checklist-Can-Make-You-a-Better-Investor
• Reddit, r/ValueInvesting — 50-Question Stock Investing Checklist: https://www.reddit.com/r/ValueInvesting/comments/1tu3vjv/50question_stock_investing_checklist/
• Reddit, r/stocks — A practical checklist for evaluating a stock before doing deeper research: https://www.reddit.com/r/stocks/comments/1w8d2ut/a_practical_checklist_for_evaluating_a_stock/
Disclaimer:
This article is for educational purposes only and does not constitute financial, investment, or legal advice. Always consider your own financial situation and, if needed, consult a licensed financial professional.